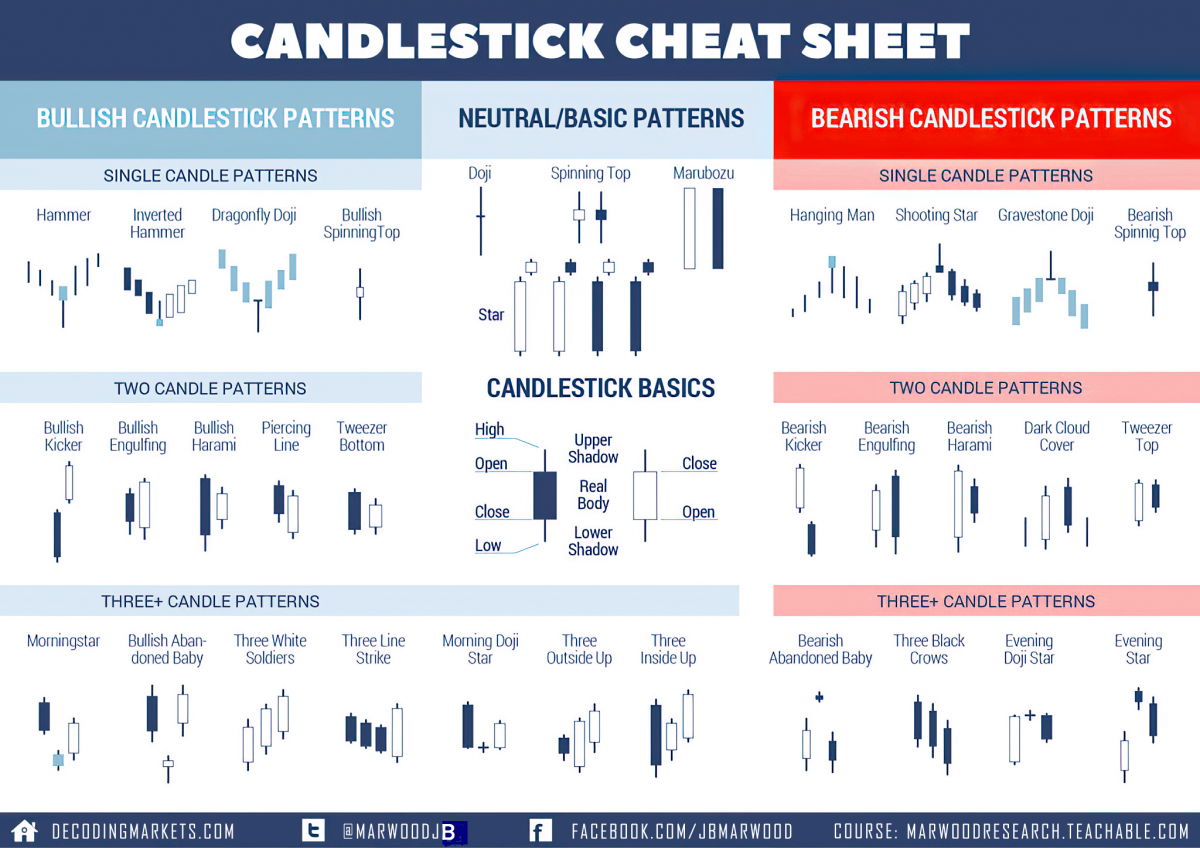
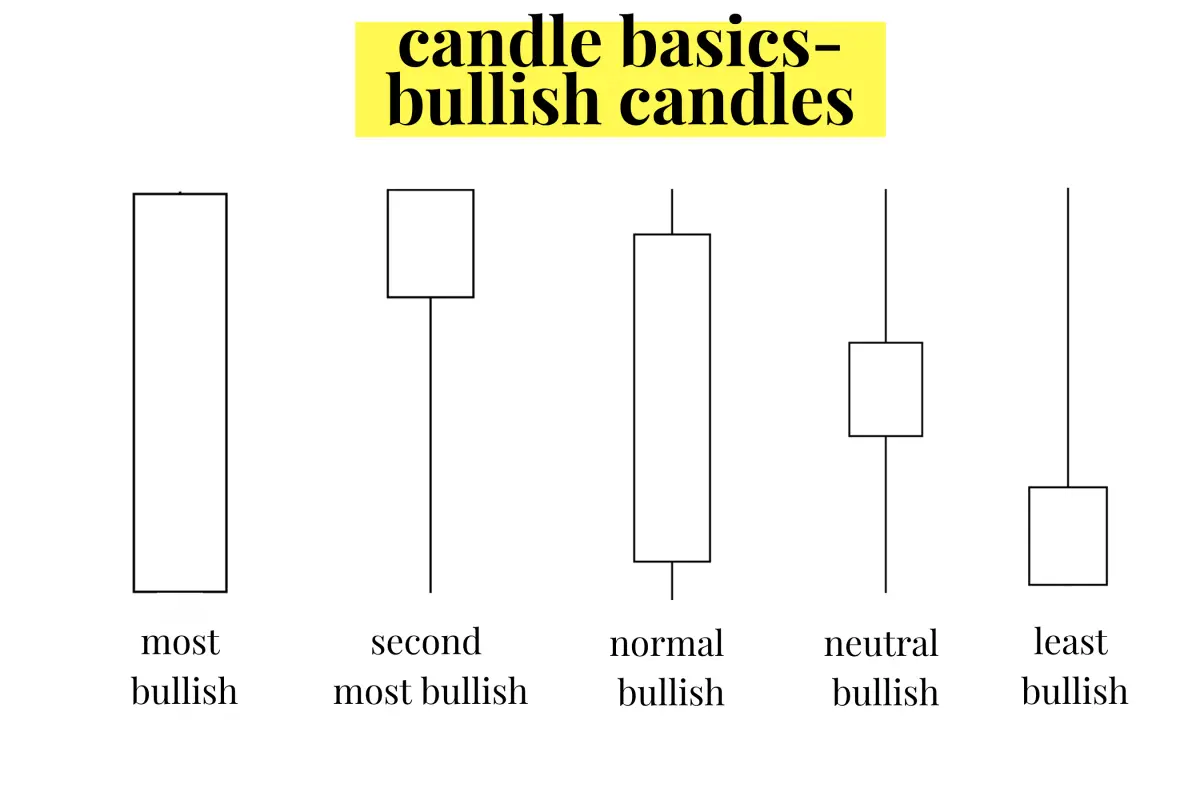
Candlestick charts are the most visual types of charts as they show the open, close, and intra-candle price action visually and with the full candle sentiment. All of the elements of the candlesticks have a technical meaning.
The color of a candlestick reflects the sentiment on the chart for the candle period.
Different Types of Candles on a Candlestick Chart
What do different color candlesticks mean?
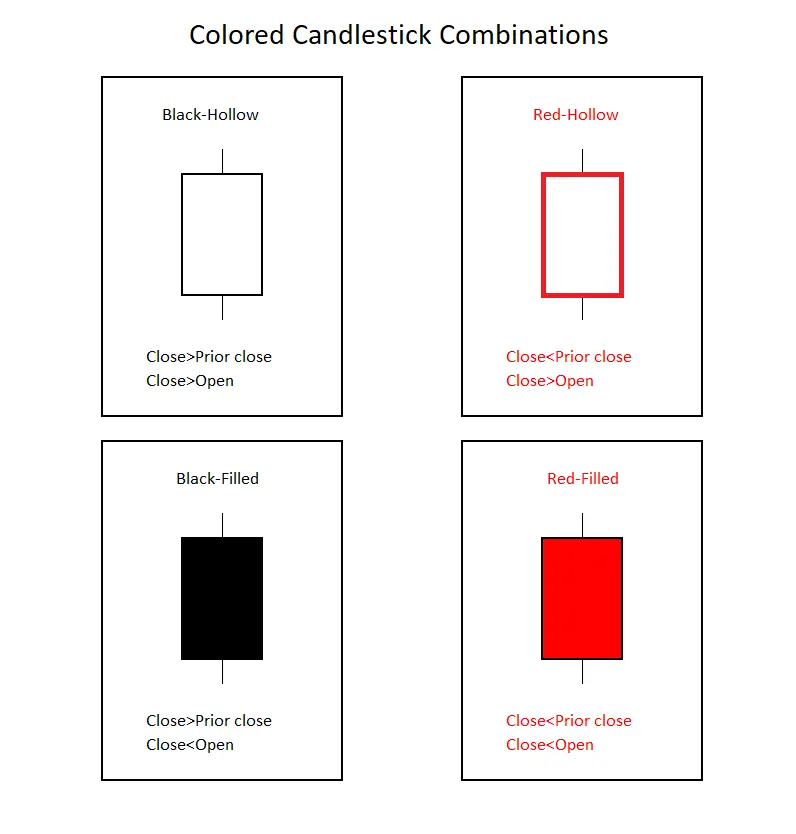
A solid white candlestick (black-hollow) is the most bullish colored single candle as it shows a close higher than the open and a close higher than the previous candle close, showing bulls in control for two days in a row. These candles are found mainly during an upswing in price on a chart.
A solid red candlestick is the most bearish single candle as it shows a close lower than the open and a close lower than the previous candle’s close, showing bears in control for two days in a row. These candles are found mainly during a downswing in price action.
A red hollow candlestick shows mixed sentiment as it’s bullish for the single candle closing higher than the open but bearish in the context of the previous candle as it is lower than the last candle’s closing price. These hollow-red candles are found mainly in a price range on a chart.
A solid black candlestick shows mixed sentiment as it’s bearish for the single candle closing lower than the open but slightly bullish in the context of the previous candle as it’s higher than the last candle’s close. These candles are found mainly during upswings in price action that are reversing into downswings starting to go sideways in price action. A black candlestick shows that buyers are absent at higher prices on the chart.
What does a huge candlestick mean?
Let’s look at large candles.
A large candle body shows strong momentum in one direction as the close is far away from the open. Large candles have more meaning when they are matched with volume. A large white candle shows that bulls have taken control of price action, while a large red candle shows that bears are in control. The next candle after this one that matches the direction will signal the follow-through in the chart in that direction. Big candles can be signals of the current directional swing on the chart. These large candles increase the odds of the directional move they point to.
What are the different types of candles on a chart?
Bullish Candlesticks
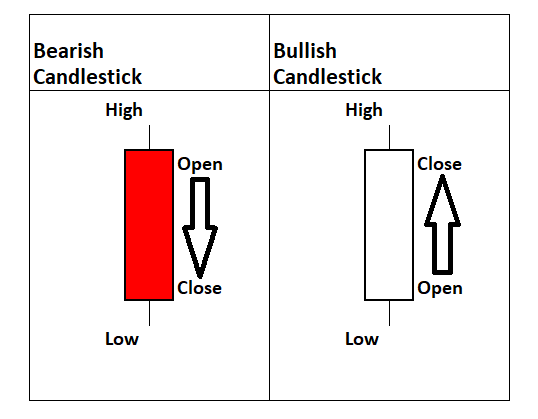
(Most bullish) Bullish Marubozu candlestick: This large bullish candle usually signals the change in sentiment on a chart to bullish and is usually found near the bottom of a downtrend. News events usually cause the move higher with a change in sentiment.
(Second most bullish) Bullish Hammer: This candle usually signals a low is in on a chart as the lower prices are rejected. The bullish hammer can be a part of a bullish morning star pattern signaling the lows are in on a chart.
(Normal bullish) Big bullish candle: A large bullish candle signals that the bulls currently have control of the chart.
(Neutral bullish) Bullish Spinning Top: A bullish spinning top shows uncertainty and can signal the end of an upswing and the beginning of a range-bound chart.
(Least bullish) Bullish reversal candle: This candle can signal the end of an uptrend, show that upward momentum is ending and that the chart could go back into building a price range before any more upside.
Bearish Candlesticks
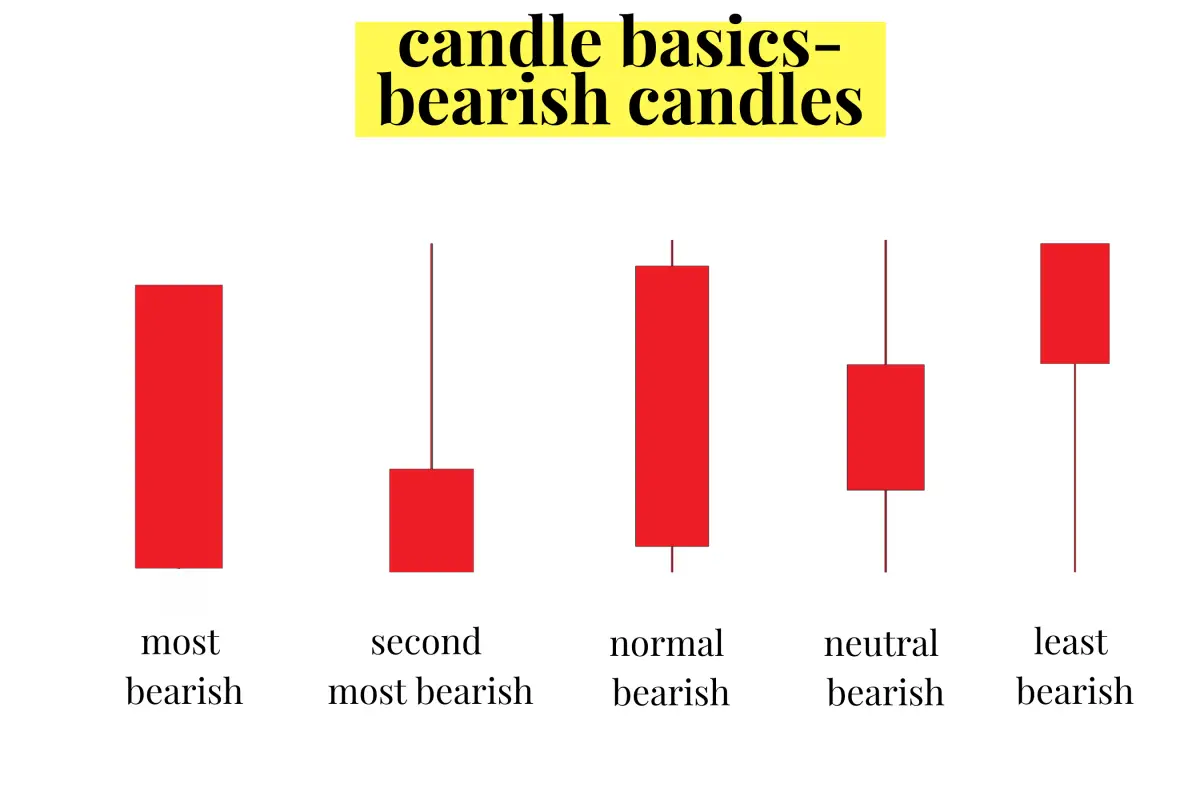
(Most bearish) Bearish Marubozu candlestick: This large bearish candle usually signals the change in sentiment on a chart to bearish and is usually found near the top of an uptrend. News events usually cause the move lower with a change in sentiment.
(Second most bearish) Bearish reversal candle: This candle can signal the end of a downtrend, show that downward momentum is ending and that the chart could go back into building a price range before any more downside.
(Normal bearish) Big bearish candle: A large bearish candle signals that the bears currently have control of the chart.
(Neutral bearish) Bearish Spinning Top: A bearish spinning top shows uncertainty and can signal the end of a downswing and the beginning of a range-bound chart.
(Least bearish) Bearish Hammer: This candle usually signals a high is in on a chart as higher prices are rejected. The bearish hammer can be a part of a bearish evening star pattern signaling the highs are in on a chart.
Reversal Candlesticks
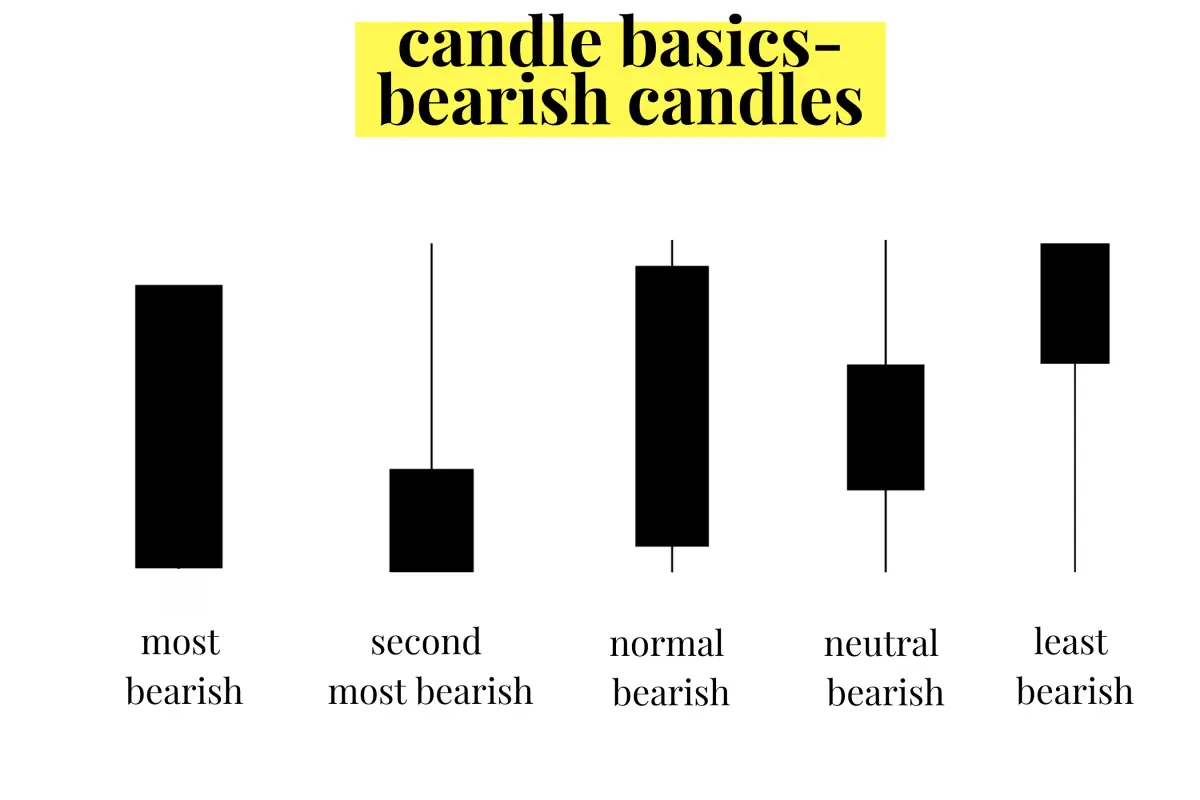
(Biggest reversal) Reversal Marubozu candlestick: These large reversal candles are rare and tend to happen at the end of a failed up move in price. These are usually volatility events caused by news where the price has a huge rally that is used to sell into. These moves happen in the most unstable and volatile markets and are generally caused by government or central bank uncertainty.
(Second biggest reversal) Reversal Inverted Hammer: This candle usually marks the short-term top on a chart and is followed by a downtrend in price as buyers fail to hold the new highs. Many times it’s the middle candle in the bearish evening star pattern.
(Normal reversal) Big reversal candle: The large black candle is commonly bearish on most charts signaling a reversal followed by a range or downswing on the chart.
(Neutral reversal) Reversal Spinning Top: The candle can signal that the chart is likely in a sideways range as both bulls and bears have failed to maintain control of the move.
(Third biggest reversal) Reversal candle: The black hammer candle is one of the most uncertain candles as it fails to go lower but also fails to return to previous highs. This is usually a volatility signal and a wide trading range on a chart after it appears.
Candlestick Cheat Sheet
Here is a complete candlestick pattern cheat sheet to see the individual candlesticks inside the context of bigger patterns. Single candlesticks have more meaning in their relationship to the candles before and after them on a chart.
Candles are just individual signals on a chart; they are more accurate when they have confluence with other technical indicators in the context of the current chart’s overall trend. Also, their usefulness in creating profitable trades is based on using them to create good risk/reward ratios and trade management, not as magic predictors of future price action.
