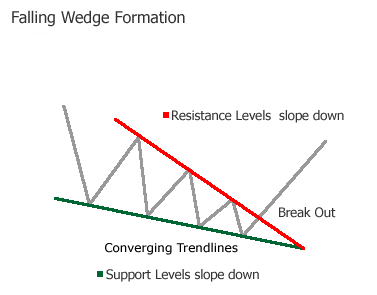
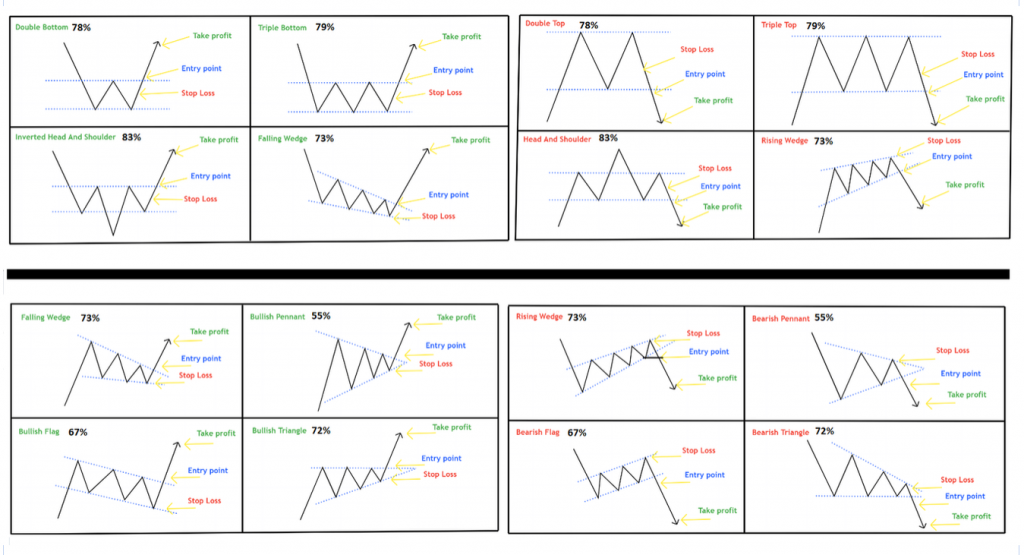
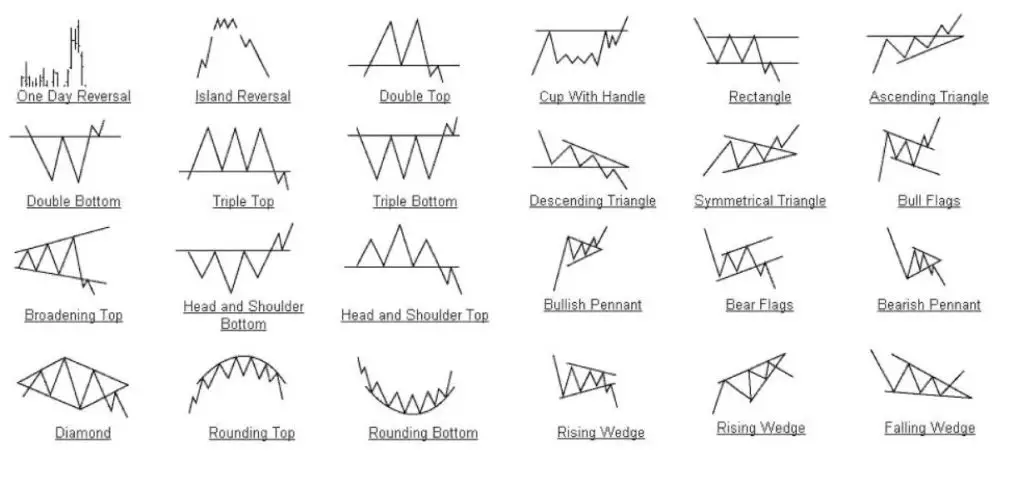
The rising wedge chart pattern can fit in the continuation or reversal category. When it is a continuation pattern it will trend up, however the slope in the wedge will be against the overal... Read more
An exhaustion gap is a bearish reversal signal on a chart that occurs after a sharp move higher. An exhaustion gap happens near a high in price on a chart when a space forms between a closin... Read more
The inverted cup with handle is a reversal pattern and momentum sell short signal as it breaks down out of the ‘handle’ in the formation. It is usually a topping pattern after a strong move... Read more
According to Thomas Bulkowski, the best performing and also most likely to be profitable chart patterns are: bullish flags that are high and tight that breakout to the upside and complex hea... Read more
This post is an example of one of the chapters in my new book ‘The Ultimate Guide to Chart Patterns‘. Image by Atanas Matov Chart Facts: The bear flag pattern is a continuation p... Read more
The Butterfly Pattern uses the identification of quantified structures on a chart that has specific and sequential Fibonacci ratio alignments that show harmonic patterns. These patterns calc... Read more
Price action trading creates chart patterns in the financial markets through the buying and selling of positions by traders and investors. A chart pattern is a visual record of the votes by... Read more
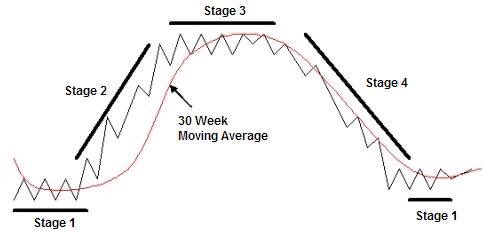
Chart patterns are visual representations of the behaviors of buyers and sellers around different price levels. Chart patterns are bullish when a chart is making higher highs and higher lows... Read more
A spinning top is a single candlestick pattern that has a body in the middle of two longer wicks. A spinning top chart pattern is a signal that neither buyers or sellers have control of pric... Read more
The piercing pattern candlestick chart is a two day price action pattern. It is created after one large down black or red candlestick followed by one large up white or green candlestick that... Read more