The piercing pattern candlestick chart is a two day price action pattern. It is created after one large down black or red candlestick followed by one large up white or green candlestick that... Read more
Bearish candlestick patterns on a chart visually show selling pressure. These patterns can show the possibility of a price reversal during an uptrend or the continuation of a downtrend alrea... Read more
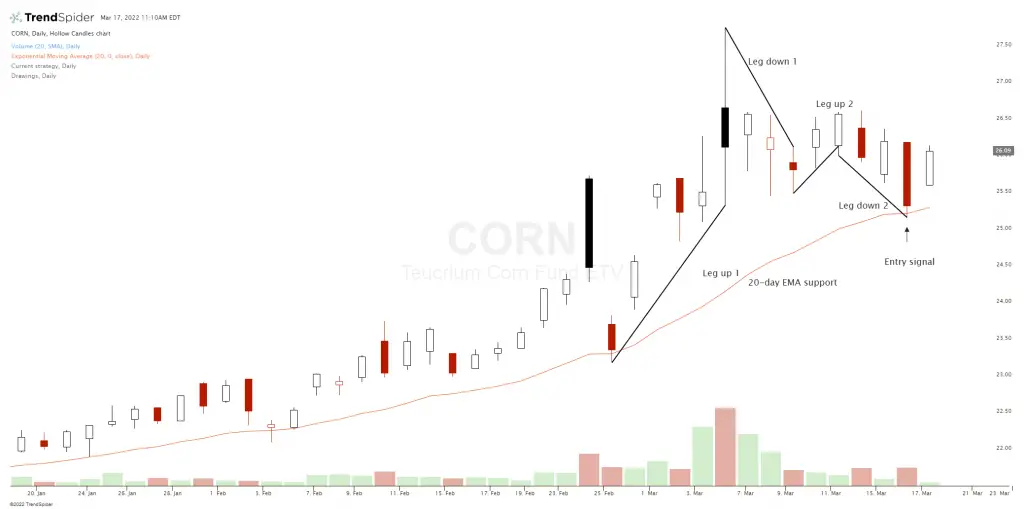
A retracement on a chart means that there is a temporary pullback on the direction of the price action against the longer term trend. A retracement can return to a previous vertical support... Read more
The inverted hammer pattern is a type of candlestick located at the end of downtrend and is used by technical analysts as a bullish reversal signal from the lows. The inverted hammer candle... Read more
An Evening Star is a group of candlesticks that create a chart pattern used in technical analysis to signal a high probability that a current uptrend in price could reverse. This is a bearis... Read more
The Quasimodo chart pattern is a lesser known bearish chart formation in technical analysis. It has also been called the Over and Under chart pattern. This pattern can identify a high probab... Read more
A bullish pennant chart pattern can be a powerful bullish chart pattern that is found during strong bull markets that is very similar to the bull flag. They are more rare than a bull flag. T... Read more
In technical analysis the triple top chart pattern can be a possible signal for a reversal lower in price. This pattern is formed when price action find resistance inside a price zone three... Read more
A candlestick chart is a type of visual representation of price action used in technical trading to show past and current price action in specified timeframes. Most candlestick charts will... Read more