A candlestick is a type of chart used in trading as a visual representation of past and current price action in specified timeframes. A candlestick consists of the body with an upper or lower wick or shadow. Candlesticks are created using the opening and closing prices along with the trading range of the candlestick period.
How do you read a candle chart?
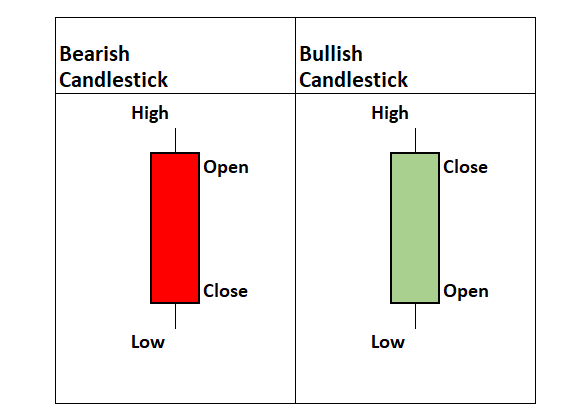
Most candlestick charts show a higher close than the open as represented by either a green or white candle with the opening price as the bottom of the candle and the closing price as the high of the candle. Also, most candlestick charts show a lower close than the open represented by either a red or black candle with the opening price as the top of the candle body and the closing price as the low of the candle body.
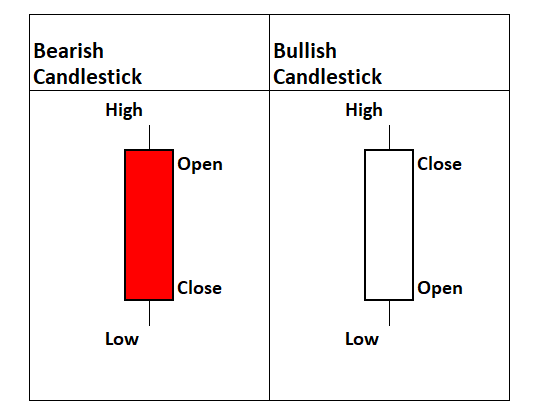
Price action that happens outside the opening and closing prices of the period are represented by the wicks or shadows above the body of each candle. Upper wicks represent price action that occurred above the opening and the closing prices and the lower wicks represent price action that occurred below the opening and closing prices.
Candlesticks are one type of chart that can be used in technical analysis to look for repeating patterns and in correlation with other technical indicators and signals.
Candlesticks are combined in many patterns to try to read the behavior of traders and investors in buying and selling to create good risk/reward setups for trading.
Candlestick charts have different settings. Candlesticks can be set to be green/red or they can be set as hollow candles. With the green/red settings the green candles occur when price closes higher than the previous close and red candles occur if price closes lower than the previous close.
Hollow candlesticks are made up of four components in two groups. First, a close lower than the prior close gets a red candlestick and a higher close than the previous close gets a white or black candlestick. Second, a candlestick is hollow when the close is above the open and filled when the close is below the open. The following image shows the four possible hollow and filled candle combinations when using hollow candlestick chart settings.
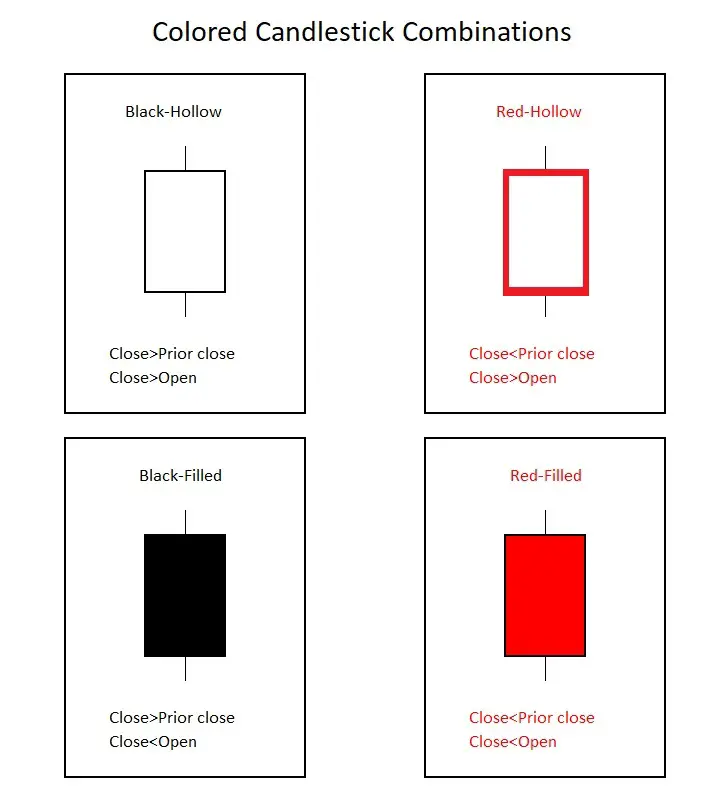
Red-hollow candlesticks can show some bullish reversal price action on an overall bearish chart. Even as the closing price was lower than the previous close making the candle red the price action moved higher during the period after the open making it hollow. Even though it closed lower than the previous trading period, there was buying pressure near the lows that made it close higher than the open.
The solid black-candle is the inverse price action of the red-hollow candle. Even though the closing price was above the previous close making it black, price action did finish lower than the open to make it a black-filled candle. Even though a black-filled candle closes higher on the current period versus the previous period, it does show selling pressure after the opening price. This candle shows rejection of intraday highs and can be a standalone signal of a bearish reversal during an upswing or uptrend in price action especially near new highs in price.
There are four types of hollow candlesticks:
- Hollow candles occur when the price closed higher than it opened.
- Filled candles occur when the price closed lower than it opened.
- White candles occur when the price closed higher than the prior close and higher than the open.
- Red candles occur when the price closed lower than the prior close.
Note that white candles have black outlines and will at times also be called hollow black candles.
How can you tell if a candle is bullish or bearish?
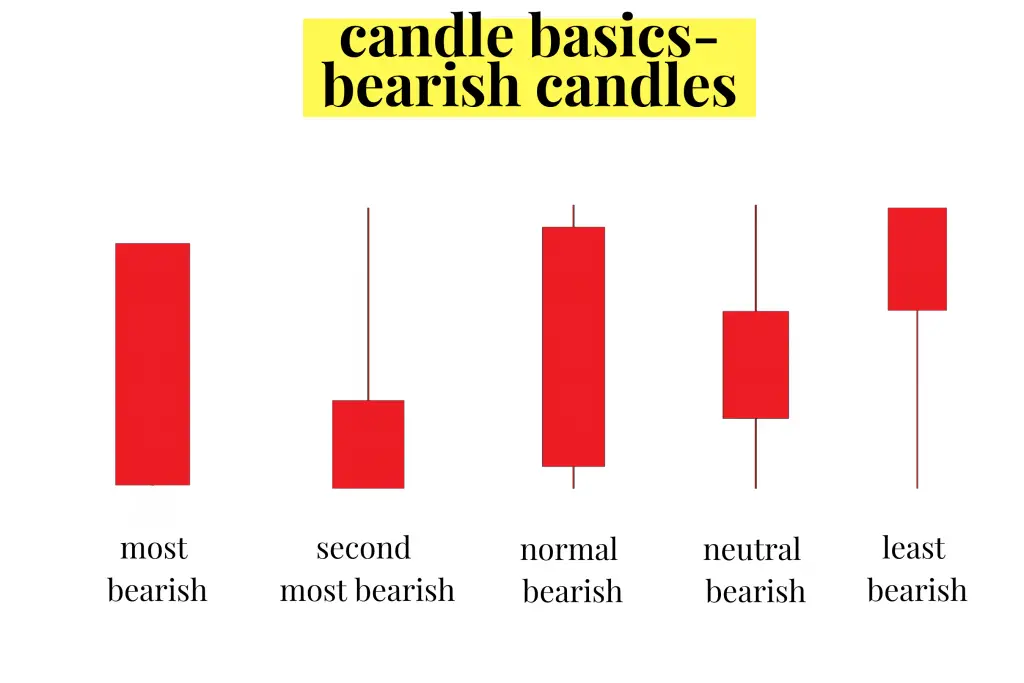
For individual hollow candles the white ones tend to be bullish and the solid red ones tend to be bearish. The larger the size of the candle itself the greater in magnitude the sentiment is thought to be. Of course candlesticks must be taken inside the context of the complete chart pattern and the multiple candlestick formation.
Bearish candlesticks:
Bullish candlesticks:
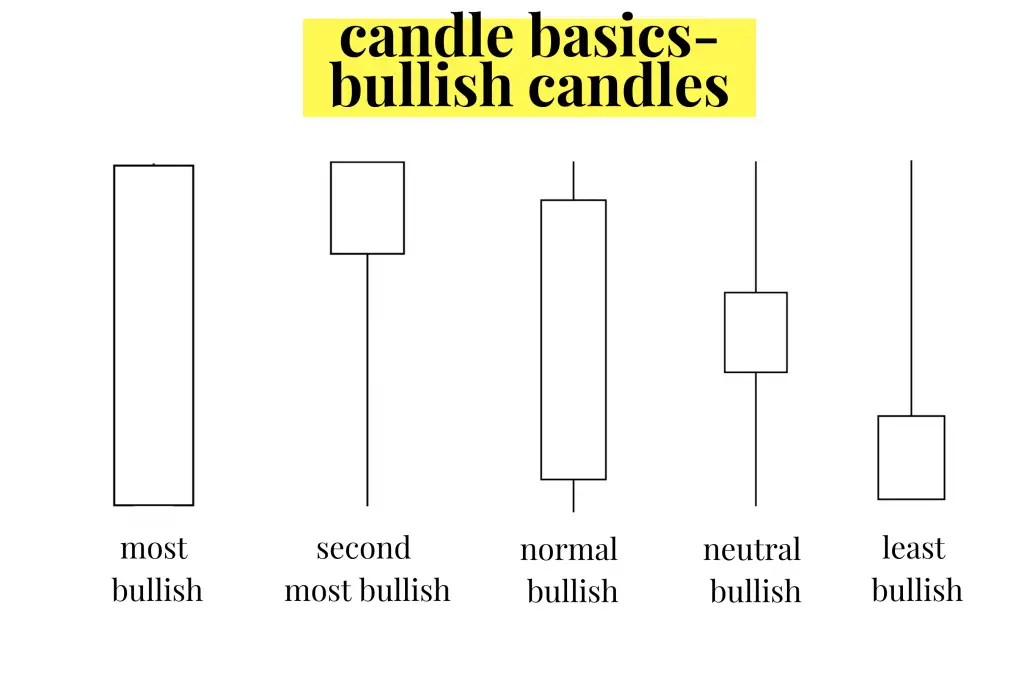
What are basic candlestick patterns?
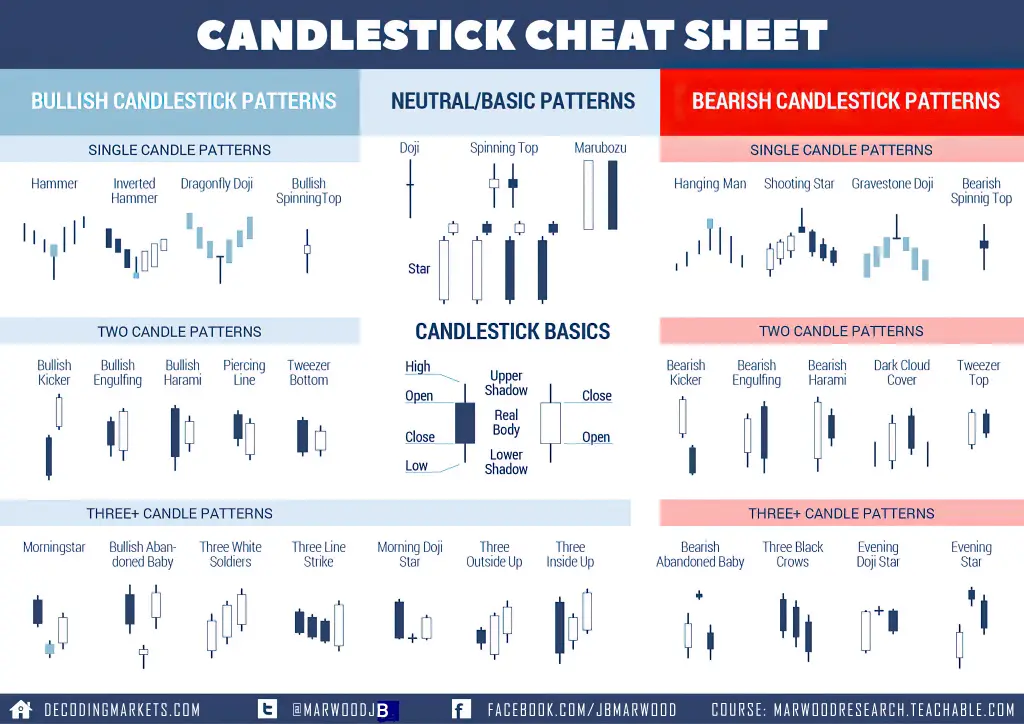
Here are some of the most popular bullish candlestick patterns with links to descriptions:
- Hammer
- Inverted Hammer
- Dragonfly Doji
- Bullish Spinning Top
- Bullish Kicker
- Bullish Engulfing
- Bullish Harami
- Piercing Line
- Tweezer Bottom
- Morning Star
- Bullish Abandoned Baby
- Three White Soldiers
Bullish candlestick patterns visually show the success of buyers to take a price higher and buying take control of a chart for the timeframe of the price action. These are bullish signals that need confirmation with an upswing in price after the pattern forms.
The meaning and value of bullish candlesticks must be considered taking into the context of a chart pattern and their confluence with other signals. A bullish candlestick pattern that happens when a chart is oversold could signal a reversal of a downtrend. Bullish candles that happen late in an uptrend after a long term run in price after a chart is already overbought can have a lower probability of success.
Bullish candlestick patterns that have a confluence with other systematic buying signals increase the odds of a trades success.
Here are some of the most popular bearish candlestick patterns with links to descriptions:
- Hanging Man
- Shooting Star
- Gravestone Doji
- Bearish Spinning Top
- Bearish Kicker
- Evening Star
- Bearish Engulfing
- Bearish Harami
- Dark Cloud Cover
- Tweezer Top
- Bearish Abandoned Baby
- Three Black Crows
- Evening Doji Star
- Evening Star
Bearish candlestick patterns visually show the failure of buyers to take a price higher and sellers take control of a chart for the timeframe of the price action. These are bearish signals that need confirmation with a down swing in price after the pattern forms.
The meaning and value of bearish candlesticks must be considered taking into the context of a chart pattern and their confluence with other signals. A bearish candlestick pattern that happens when a chart is overbought could signal a reversal of an uptrend. Bearish candles that happen late in a downtrend after a long term drop in price after a chart is already oversold can have a lower probability of success.
Bearish candlestick patterns that have a confluence with other systematic short selling signals increase the odds of trade success.
Here is a candlestick cheat sheet illustrated guide for quick reference:
For a deep dive into learning all the most popular candlestick patterns you could see on charts, you can also check out my book: The Ultimate Guide to Candlestick Chart Patterns