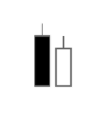
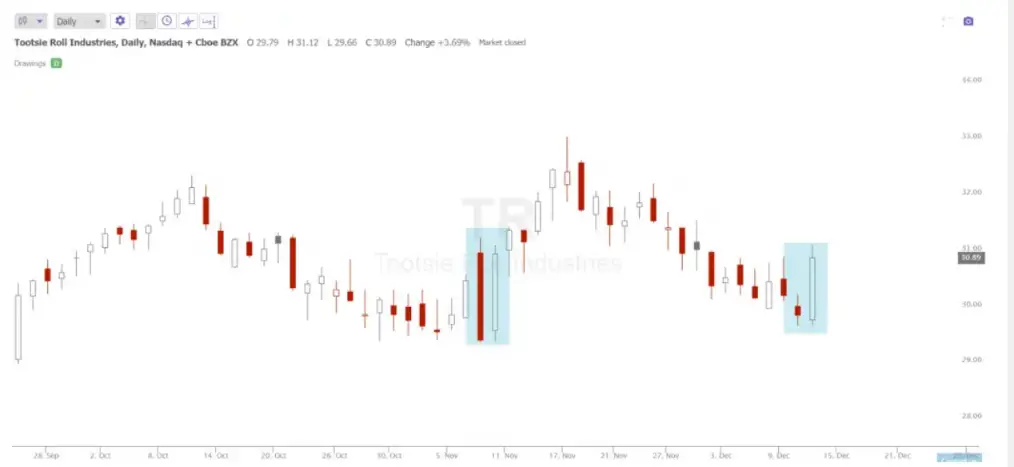
The tweezer bottom candlestick pattern is created by two or more candles with matching lower lows. A tweezer bottom happens when two candlesticks form back to back or near each other with the exactly or almost the same lows. This pattern is more meaningful when there is a strong move in momentum from the first candle to go lower then the second candle going higher off that low showing a reversal in the direction of price action.

The two candles that create this pattern don’t have to be in consecutive order and the size and colors can be different. The tweezer bottom candle signal is a high probability reversal signal that is more meaningful when it happens at a confluence of other signals on a chart like oversold or near a key moving average. This pattern has additional confirmation when it is followed by another bullish candle pattern.
The tweezer bottom candlestick pattern is a dip buying signal that waits on a high probability bounce to happen as consecutive low prices hold at support and bounce with at least two candles. A tweezer bottom can be separated by a few candles but the most popular classic version of this pattern happens over two consecutive candles.
