Skip to content

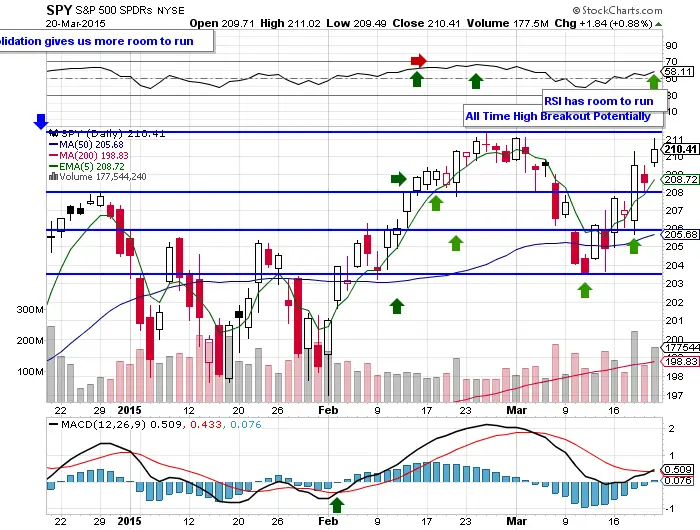
- Next resistance level is all time highs at $212.97 there is a high probablity we get there next week.
- The RSI is bullish and there is room to get back to all time highs without becoming over extended.
- $SPY had a bullish MACD crossover on Friday.
- All near term support lines held last week.
- The bulls liked the FED statement leaving shorts to cover and those on the sidelines to chase the move up.
- The three up days last week had great volume.
- Friday was a gap and go momentum buy signal.
- Wednesday was a bullish engulfing candle long signal.
- Two potential trailing stops for long $SPY trades here is a close below Friday’s low or a close below the 5 day ema.
- A pull back to the 5 day ema would be a buying opportunity here.
