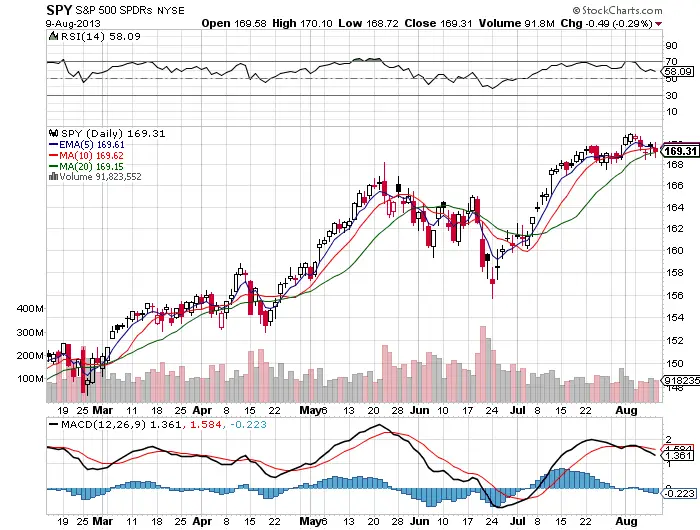
The market as a whole has slipped into a slower trading pace as summers wind down. Failure to make higher highs has disappointed many bulls. Some individual stocks have also frustrated many traders with wild volatile action like $AAPL failing at the 200 day, $PCLN rejected hard as it approached the $1,000 level, $FB grinding at the 52 week highs, and $TSLA stalling after earnings. We are moving into an active traders market and out of the smoother trend following market that was enjoyed in the first half of the year. It is a great time to take some time off or shorten time frames and wait to see where the central banks take us next.
-
After the recent failed break out to all time highs the 5 day ema has no longer been the support level for the sharp uptrend.
-
The 10 day sma is turning into a level that is becoming resistance.
-
The 20 day sma is being lost daily but the $SPY is rallying back above it.
-
For 17 trading days the $168 level has been support. If the $SPY closes below this level it could signal a correction to the 50 day.
-
The market may be changing to favoring swing traders off the support levels over trend followers trading for higher highs.
-
Leading stocks are still holding up great and pressing to new all time highs. $TSLA $FB $LNKD $PCLN
-
The key levels that may determine the next market trend will be a break a close above to new all time highs or a loss a close below the $168 support level.
-
We are currently range bound in this index.
-
The market needs a catalyst to to push us into a trend.
-
It is better at this juncture to trade leaders over the index for alpha.

