-
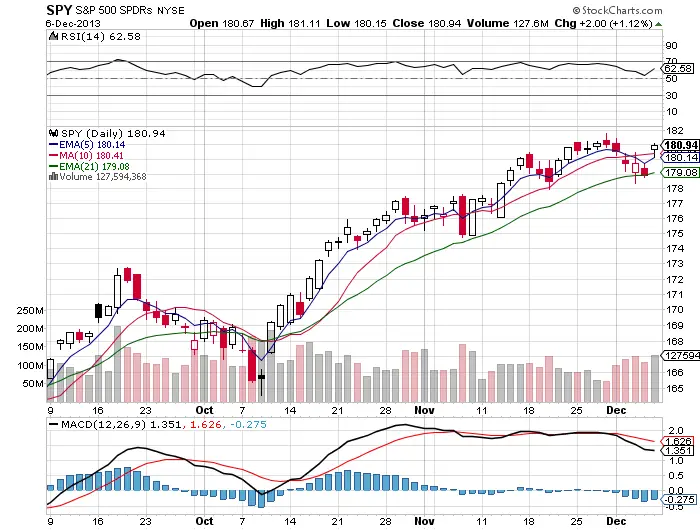
On Monday the $SPY uptrend was finally broken and the 5 day ema was lost. I was stopped out of my longs.
-
We had a five day down trend that took us back to the 21 day ema by Thursday.
-
On Thursday the 21 day ema was held as support and the line in the sand by the “Buy the dip traders”
-
On Friday we had a gap up over the 10 day sma that retraced to the 5 day ema but closed over it with momentum.
-
This triggered me to re-enter longs with the Friday low of day as my stop at the end of day.
-
We now have a high probability set up that could lead to a run to $185.
-
The RSI at 62 gives us some room to move to the upside.
-
Seasonally equity markets tend to have “Santa Claus Rallies” at this time of year.
-
Many money managers are desperately seeking Alpha after likely not beating their benchmarks this year that may lead to some playing catch up by chasing this uptrend.
-
This looks more like the beginning of a secular bull market than the end of a cyclical bull market if you look at the long term chart.
