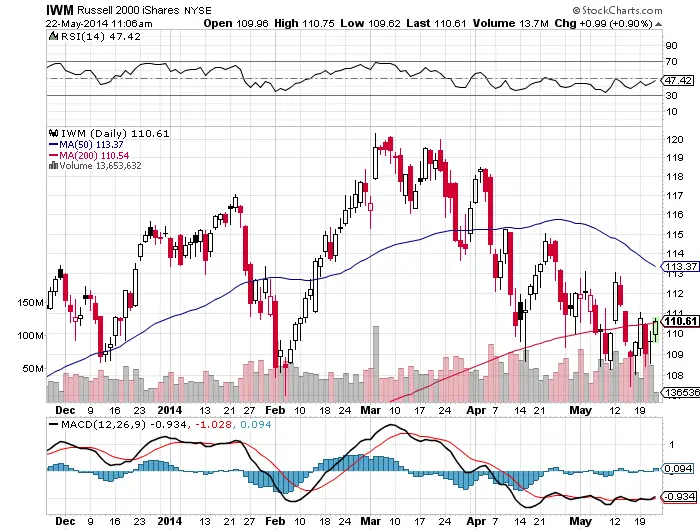
While $IWM has been fighting back and forth to take and hold the 200 day line looking more closely at the $IWM chart it appears that the sellers have been waiting at the 50 RSI level on the daily chart to exit $IWM longs. Short term moving averages have been of little use in the range bound chop and the MACD has coiled and flat lined. With this year being a tale of selling strength and buying weakness it makes sense that an oscillator would be a great tool at this time to identify a range. Since mid April the resistance has been near the 50 RSI and the support has been near the 35 RSI on the daily chart. So far this has been the current trade that I have taken advantage of for the past month, we will see how long this lasts or if $IWM can break out above the 50 RSI and trend.

