This is a guest post by Troy who is a private trader who blogs at Bull Markets
Outlook for the U.S. stock market in 2018 based on fundamentals and long term technicals
I’ve always used a medium-long term trading approach in the U.S. stock market, from my hedge fund days to the present. My Medium-Long Term Model can predict significant corrections and bull markets, but it cannot predict how the market will play out over the next year (e.g. Will it be choppy? Will volatility be low? Will there be small corrections?)
Based on current data, the model doesn’t foresee a significant correction or a bear market in 2018. In this post I’ll outline why the long term bull market is very much intact, and how the U.S. stock market will experience increased volatility (along with a correction very soon) in 2018.
*Based on current data, the model states that this bull market has 2-3 years left.
Fundamentals
Over the long run, the U.S. stock market follows the fundamentals of:
- U.S. corporate earnings.
- U.S. economy
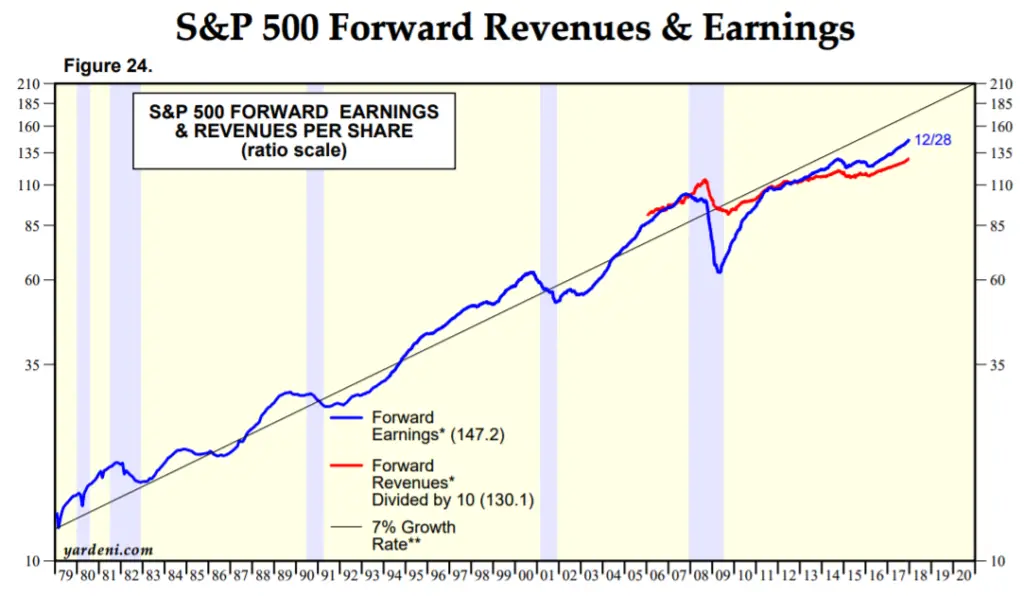
U.S. corporate earnings growth is very strong right now.
This strength comes from multiple factors.
- The U.S. economy is strong and improving, so U.S. sourced corporate revenues (and earnings) are increasing.
- The global economy (emerging markets, Europe) bottomed in early-2016 and continues to improve. Foreign revenues account for 50% of the S&P 500’s revenues.
- Oil prices continue to rebound year-over-year, which means that the energy sector is no longer a drag on U.S. corporate earnings. This is a small factor that won’t be very important in 2018 as oil prices start to stabilize.
- The Republican tax cut is a big boon to corporate earnings. It will have a limited impact on the U.S. economy, but corporations will use the additional profits for M&A deals and share buybacks. This is a long term bullish factor.
The U.S. economy is strong and continues to improve. The economy tends to deteriorate before the stock market turns down. So investors and traders shouldn’t be worried about the bull market unless they see a notable deterioration in the economy.
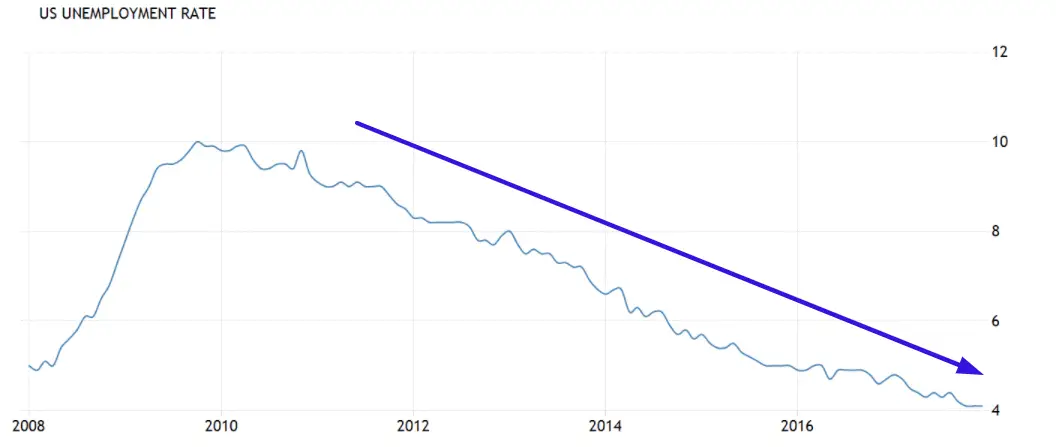
Here’s the unemployment report. It’s still trending down.
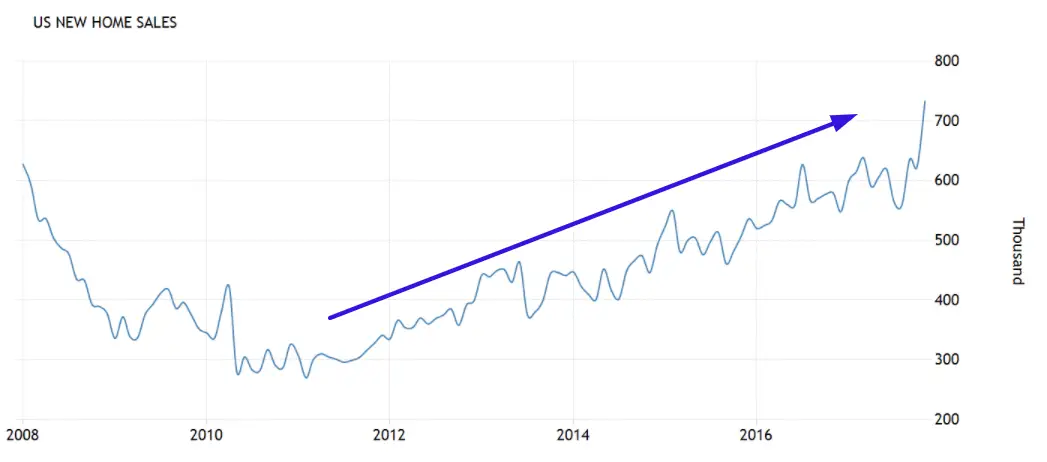
Here’s New Home Sales. Still trending higher.
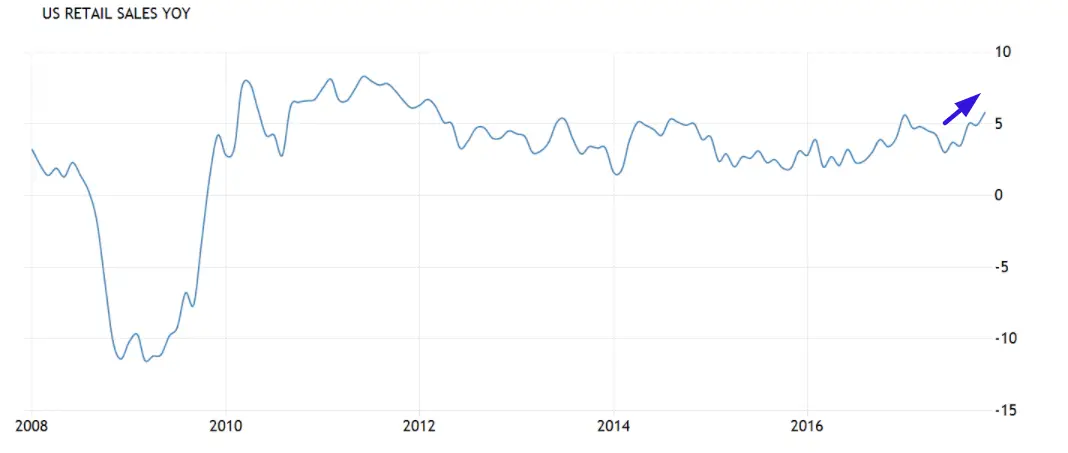
Here’s YoY growth in Retail Sales. It’s going up. YoY growth tends be flat before a bear market and recession begins.
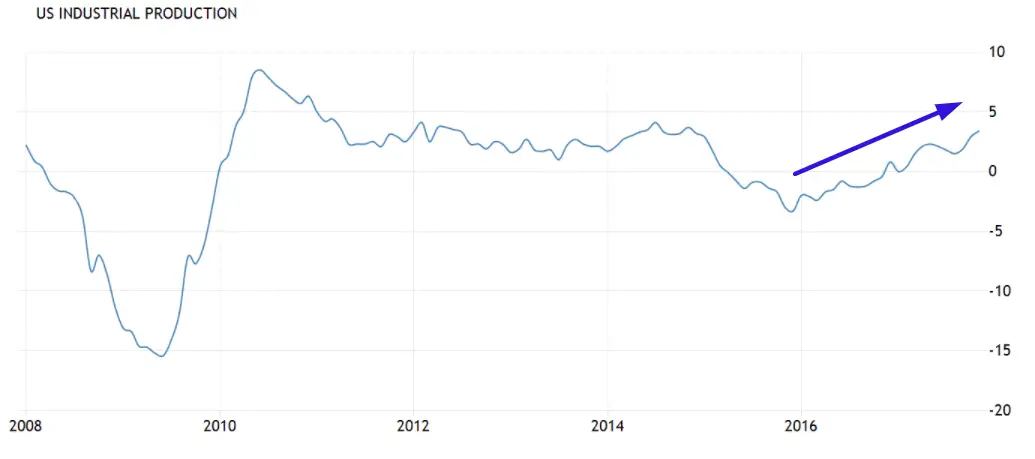
YoY growth in Industrial Production is also trending higher.
Now that we’ve established the long term bull market is ok, let’s look at the medium term. Various studies all demonstrate that there will be no significant correction in 2018.
Technical studies
The U.S. stock market’s rally in 2017 was marked by low volatility. It wasn’t an exceptionally big rally: 20% a year isn’t extreme in history. It was exceptionally steady, on par with 1995 and 1964. Whenever the stock market has a year of low volatility, the next year follows a similar pattern:
- The stock market goes up over the next year, but…
- Volatility increases, and there are 6%+ “small correction(s)” along the way.
This pattern is logical. It’s similar to the market making a long term bearish divergence. When the market is extremely overbought (I.e. a rally with very low volatility), the market doesn’t just die immediately. The “buy the dip” mentality is so strong that a small correction will not turn into a significant correction. The market’s insanely bullish momentum needs to be weakened by a few “small corrections” before a “significant correction” can begin.
As of October 2017, this is the longest rally in history without a 6%+ correction. So from a pure probability perspective, the S&P is more and more likely to begin a correction every day.
But a TIME EXTREME is not enough. The time extreme cannot tell you if the S&P 500 will make a small correction in a week or in 4 months.
Fortunately, various signs demonstrate that a 6%+ “small correction” will begin in Q1 2018.
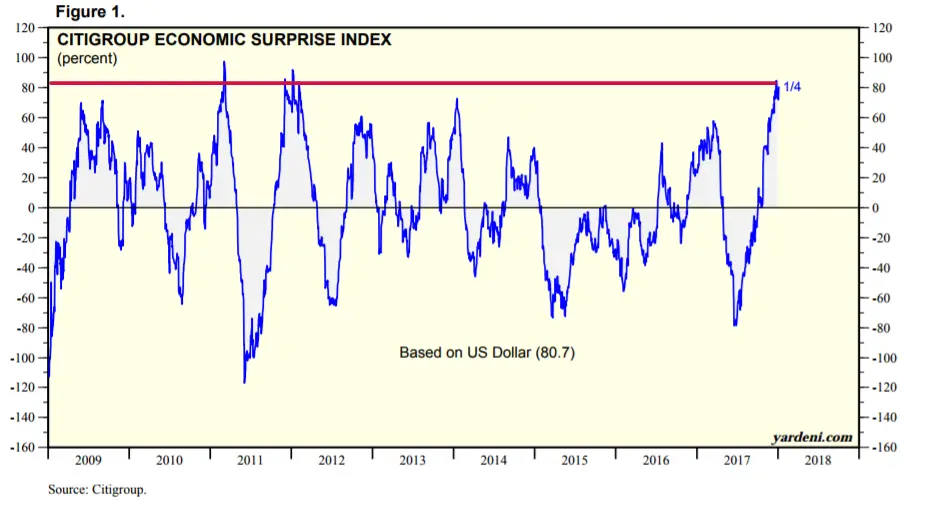
There is a weak-moderate correlation between short term fluctuations in the economic data and the U.S. stock market.
In the short term, U.S. economic data is about as positive as it gets. Hence the economic data will have to disappoint a little over the next few months.
Keep in mind that parts of the U.S. are experiencing an extremely cold winter. This seasonal factor alone will hurt January economic data (to be released in February). This adds bearish pressure on the U.S. stock market in February.
Keep in mind that earnings season begins in a week. It’s harder for the stock market to make a correction during earnings season. Most stocks beat their “estimate” simply because analysts tend to set the bar too low. That’s why a correction beginning in February is more likely than a correction beginning in January.
Thanks for reading! Troy is a private trader who blogs at Bull Markets about the financial markets.
