Here is a recent example of one of my trades.
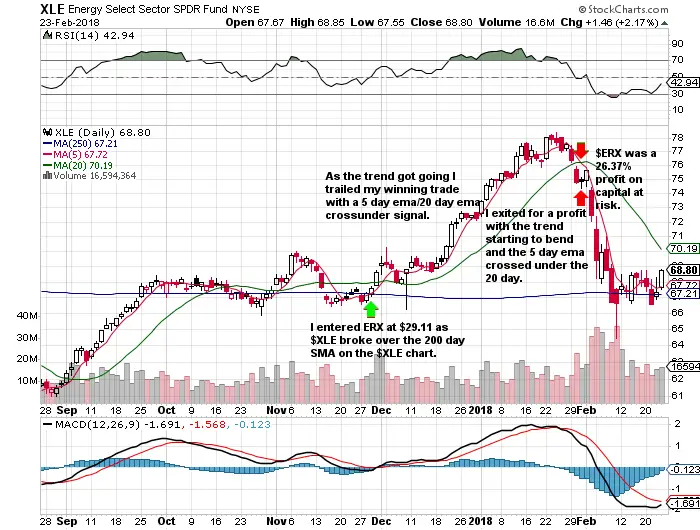
- I was looking to trade a trend in the energy sector after it recovered from it’s long term downtrend.
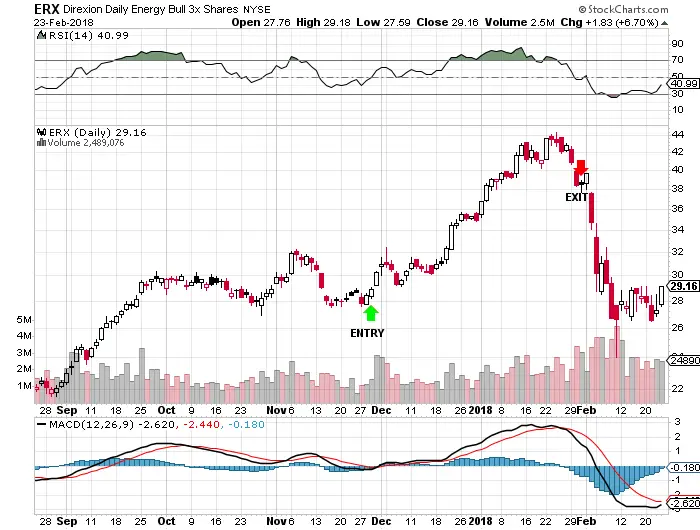
- I was using $XLE as my signal chart but I traded $ERX for leverage.
- The chart had started to turn upwards after finding a bottom.
- My signal line was going to be the 250 day SMA as it backtested well as a stand alone signal for entries and exits.
- I was stopped out for a small loss on my first buy with a price break over the 250 day SMA but entered again on the November 29th break and close above the 250 day SMA.
- I got a quick run higher and set my stop loss for a close back under the 250 day SMA.
- After some volatility it began to trend higher.
- After price quickly got extended from the 250 day SMA I moved my stop loss to a trailing stop of a 5 day EMA cross under of the 20 day EMA.
- XLE stopped going higher and then reversed with the 5 day crossing under the 20 day EMA on January 31st so I locked in a 26.37% gain on capital at risk.
- This is an example of a moving average trend trade using a long term entry signal and trailing your stop loss during a fast trend and using leverage to create Alpha in a slower moving ETF in percentage terms.
