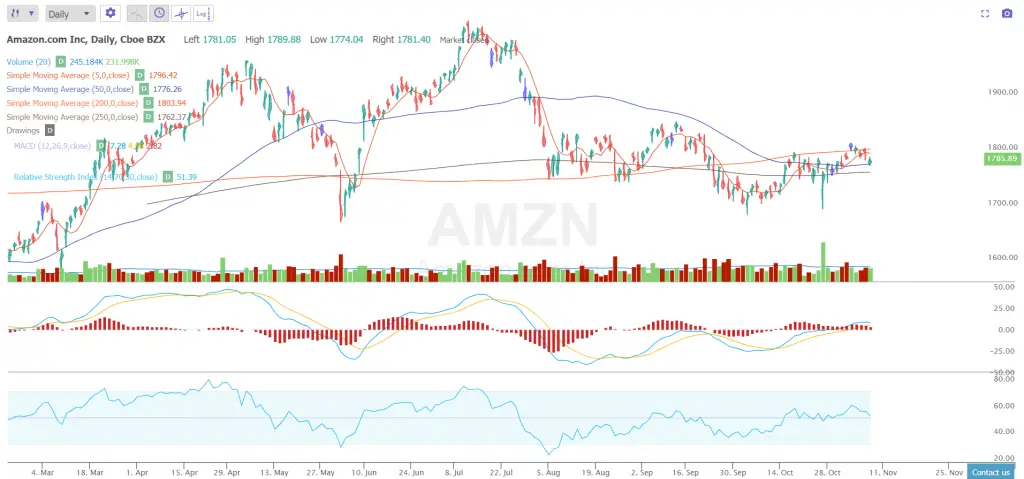
10 facts about the Amazon chart:
- Current resistance is the 200 day simple moving average. Amazon price failed at the 200 day SMA on the last three attempts to break out.
- The 250 day simple moving average has held as support since price back over it on October 14th.
- The dynamics of short term resistance and support create a range bound Amazon chart pattern that is leaning bullish but has not started a trend yet.
- The MACD continues to hold its bullish crossover from October 14th.
- The RSI is currently at 51.39 and almost neutral here.
- The Amazon chart created a double bottom chart pattern with the last two price support levels at $1685 and $1695 on the chart.
- After the earnings announcement on October 25th in after hours trading $AMZN bounced in the oversold 30 RSI zone and opened at the 38 RSI the next morning and continued to rally back over the 250 day SMA on the next trading day.
- Amazon has gone lower four straight trading days last week as the market rallied to all time highs. Amazon is showing relative weakness here.
- The next key signals I am looking for is buying a break back over the 200 day SMA or a dip to the 30 RSI. I would also buy a close under and break back over the 250 day SMA as both moving average signals backtest well. 200 day SMA signal average gain +22.07% gain and the 250 day SMA average gain is +21.32% if the moving average is allowed to play out.
- The Amazon chart remains holding the bullish 5 day / 50 day moving average crossover that is a bullish back tested signal with an average double digit return of +10.42% per trade when the crossover is traded mechanically as it plays out.
For analysis on 20 charts like this each week you can subscribe to my video newsletter here.
5 day / 50 day SMA crossover backtest:

200 day SMA backtest:

250 day SMA backtest:

Charts and backtesting courtesy of TrendSpider.com.
Here is a book with 50 Moving average signals that beat buy and hold-> Here.
