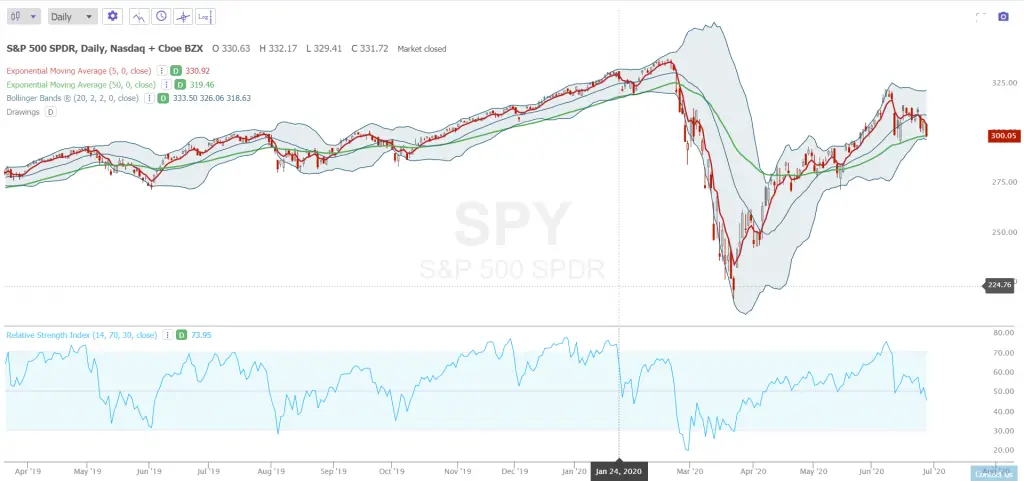
In the trading world there is an ongoing debate in many circles on whether trading price action alone is best or if technical trading indicators can add value to trading decisions.
Many believe that trading based on price alone is the best way to trade as you are don’t over complicate your decisions with the addition of other indicators. They claim that all you need is price and that indicators are just derivatives of price action. However, they overlook the fact that indicators are just another way to filter, quantify, measure, and express price action. Indicators take nothing away from your ability to see the price action on your chart they just measure it and show you another view.
Another claim is that indicators are lagging. The error in this thinking is that there are leading indicators, both price action and technical indicators are always showing the past not the future. Indicators measure past price action, as each new price is printed on the chart it is in the past. Trading price action using chart patterns is trading the history of the price that created an eventual breakout signal. Both price and indicators are lagging as neither happens in the future.
Many love the simplicity of trading price alone but at times of high volatility it can be easier to trade with technical indicators like moving averages, MACD, or RSI as they will help filter out much of the chop in price action and give less signals than pure price trading. A price action trader may get five false breakout signals of a range while a moving average crossover trader may only get one entry signal saving them from several losses by waiting for a more meaningful signal. Moving averages can smooth out the price action of a trend.
Some traders can see indicators as making charts messy and cluttered versus just price action. The truth is you can use too many indicators and confuse yourself with conflicting signals. The best way to use indicators on your chart is to keep them limited to one for momentum like moving averages, one to measure overbought/oversold like RSI, and one for reversion to the mean like Bollinger Bands. All these indicators can help you see where price action is in its cycle in relation to historical metrics.
Another point price action purists bring up is their belief that professional traders don’t use technical indicators, however, that is simply not true as many Market Wizards have talked about their use of technical indicators in interviews and in their writings. Paul Tudor Jones, Jerry Parker, and Ed Seykota all mention their own use of moving averages at times in their trading, risk management, or backtesting for system development.
Both price action and technical indicators can be quantified and backtested and used as trading signals. So whichever one you use, both trading price action or technical indicators are usually much better strategies than trading based off your own or other’s opinions or predictions.
I have created this Price Action 101 eCourse for traders that are looking for a shortcut to learning the basics.


