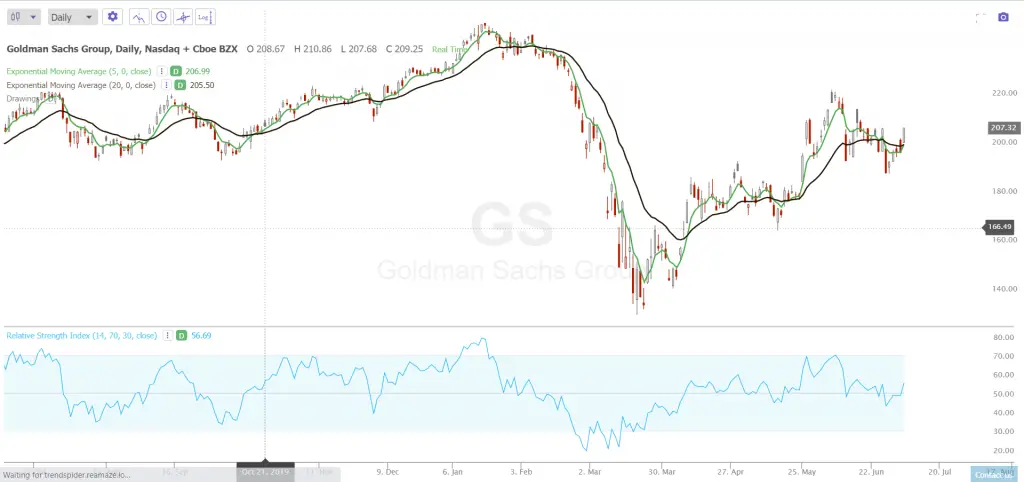
Simple trend trading signals have the best chance of having an edge as they create big wins and small losses by their structure of letting winners run and cutting losers short. Also, adjusting a trend signal that is a positive expectancy model with a simple filter can improve its risk/reward ratio.
A trader will have to understand how it may alter both the size of losses and the size of winners from a backtest of the original system. Some adjustments can be backtested with the new parameters and others involve a discretionary dynamic to a mechanical system.
The traditional view of the RSI is as an indicator of when price action has moved too far and too fast in one direction. For swing and trend trading on the daily chart the RSI is commonly set at 14 days. A 30 RSI means that a chart has become oversold and a 70 RSI can mean that a chart has become overbought.
Adding an RSI filter to a trend trading system can stop you from taking a buy signal if a chart is already overbought when an entry signal is given. It can also have you lock in profits if a chart becomes overbought while holding a long position instead of waiting for the cross under to play out.
For example a trader may buy the 5/20 day ema crossover on the Goldman Sachs chart based on the backtest data but look to exit near the 70 RSI or not buy the crossover if the signal is given over the 60 RSI. Historically on the GS chart the reward of higher prices tends to diminish as GS has a reading near 70 RSI and it is possible to increase the size of wins many times by locking in profits into the strength of the rally instead of waiting for the 5 day ema to cross back under the 20 day ema as a trailing stop.
The possible drawbacks of exiting near the 70 RSI is if you are out you have to wait for a new 5 day / 20 day ema crossover to happen to signal a new entry. If the trend consolidates and continues after you have locked in profits you will miss more upside and reduce the size of the wins that were shown in the backtest.
By exiting near the 70 RSI it is possible to lock in more profits on average but not have as big of wins as you will miss parabolic uptrends. Not entering if the RSI is over 60 could reduce the size of your losses when it is too late in a trend and you miss some of the reversals against you.
These are suggestions for adding the RSI as a risk/reward filter to a moving average crossover signal but you need to research each stocks chart history to see the best adjustments that you could make to improve on the sizes of wins and losses in a positive way.

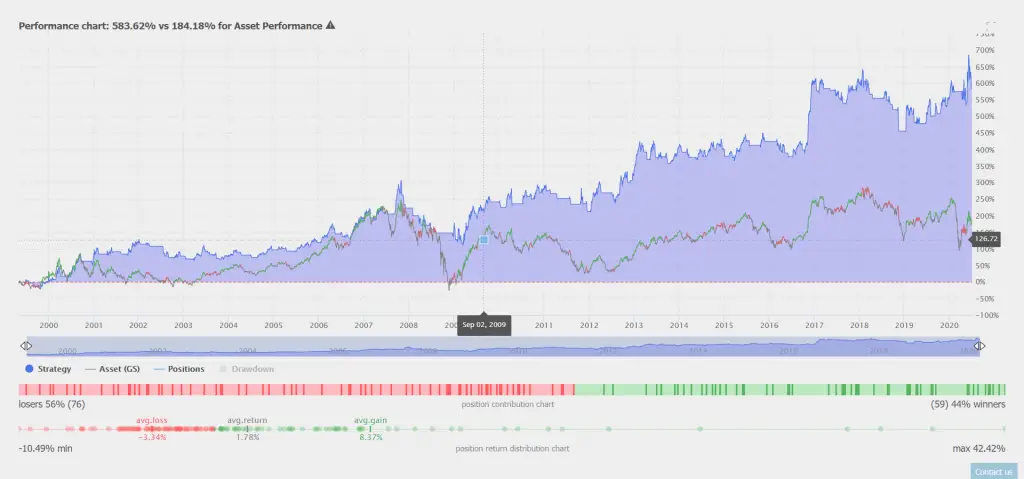
The below backtesting data is for the pure 5/20 day ema crossover and crossunder strategy is on GS and does not include RSI filter adjustments.
