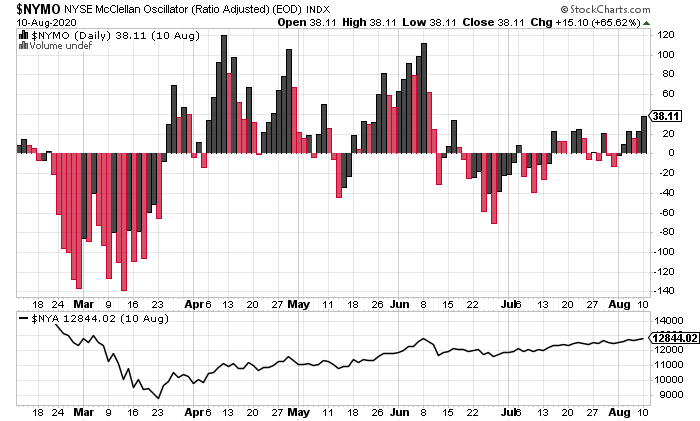
The McClellan oscillator is a market breadth technical indicator used by traders to analyze the New York Stock Exchange listings balance between the advancing and declining stocks over time. The McClellan oscillator quantifies the Advance-Decline Data on a stock market exchange, it could also be used on stock indexes, portfolio holdings, or any watchlist of stocks.
The McClellan oscillator was created in 1969 by Sherman and Marian McClellan, it is computed by using the Exponential Moving Average of the daily difference of stocks higher in price from stocks lower in price over time periods of 39 trading days and 19 trading days.
The formula for determining this oscillator is:
Oscillator = (19-day exponential moving average of advances minus declines) – (39-day exponential moving average of advances minus declines) advances are the number of NYSE stocks that traded higher than their previous day close and declines are the number of NYSE stocks that traded lower than their previous day close.
The variance between advances and declines quantifies if we have greater advancing or more declining stocks on the NYSE. More advancing stocks is seen as bullish Breadth and more declining stocks is bearish Breadth sentiment.

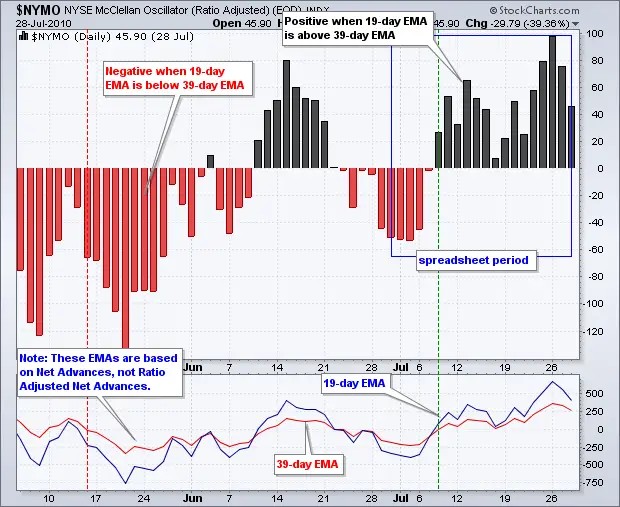
By adding a 19-day and 39-day EMAs to the variance in advances compared to declines we quantify shorter-term and longer-term Breadth sentiment.
By calculating the McClellan Oscillator as the difference in the 19-day EMA and the 39-day EMA of advances minus declines, the MACD principle is applied to the Breadth sentiment to be able to visually see changes in the shorter-term Breadth sentiment.
Crossovers of the McClellan Oscillator with its zero center line that it oscillates around would mean:
If the McClellan Oscillator crosses above its zero line it signals that the 19-day EMA of advances minus declines crossed above the 39-day EMA of advances minus declines which shows that an increase in the number of stocks going up on the NYSE is relatively strong enough to signal an uptrend on the NYSE index.
If the McClellan Oscillator crosses below its zero line it signals that the 19-day EMA of advances minus declines crossed below the 39-day EMA of advances minus declines which shows that an increase in the number of stocks going down on the NYSE is relatively strong enough to signal a downtrend on the NYSE index.
