The post is a sample of a chapter from my book The Ultimate Guide to Chart Patterns.
Bullish Flag Pattern Chart Facts:
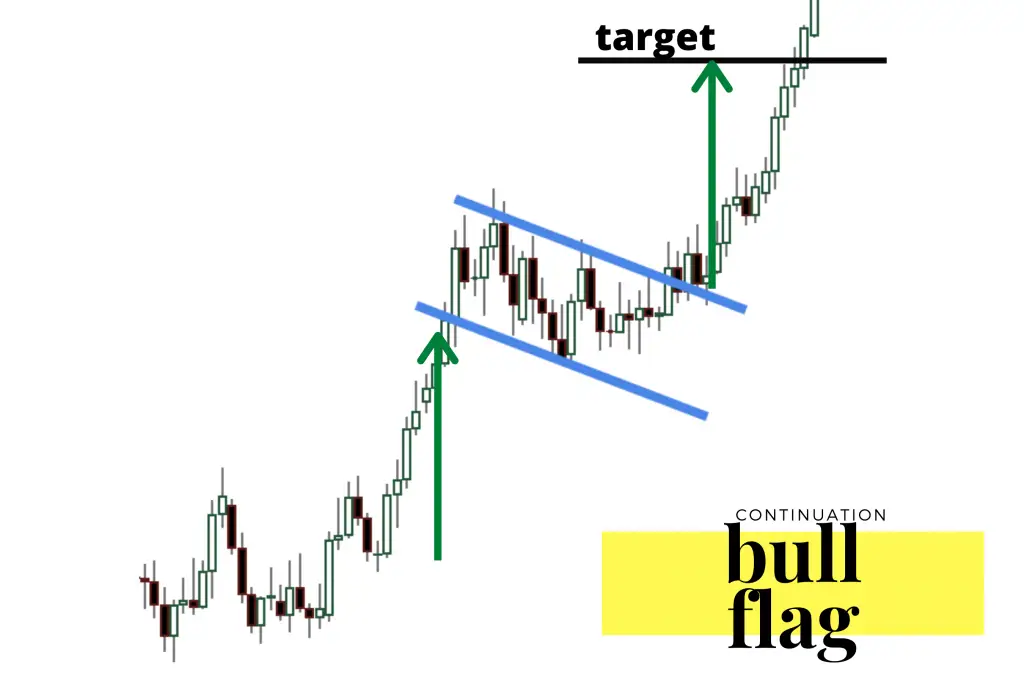
- The bullish flag is a continuation pattern of the previous uptrend.
- A bullish flag chart pattern occurs after an uptrend out of a previous price base.
- The ‘pole’ is represented by the previous uptrend in price before a price consolidation.
- The ‘flag’ is a rectangular descending price range after the uptrend to new higher prices stops. The flag has primarily lower highs and lower lows.
- The signal of the end of the flag pattern and the beginning of a new potential uptrend is when the descending upper trend line is broken with a move upwards in price.
- This pattern is thought to be the consolidation of the uptrend.
- Traditionally the move out of the flag is thought to be potentially as big in magnitude as the uptrend before the flag begins.
- A breakout of the flag with higher than normal volume increases the chance of a continuation of the uptrend.
- A stop loss can be set at the lower trend line in the flag after entry.

Image created by @priceinaction
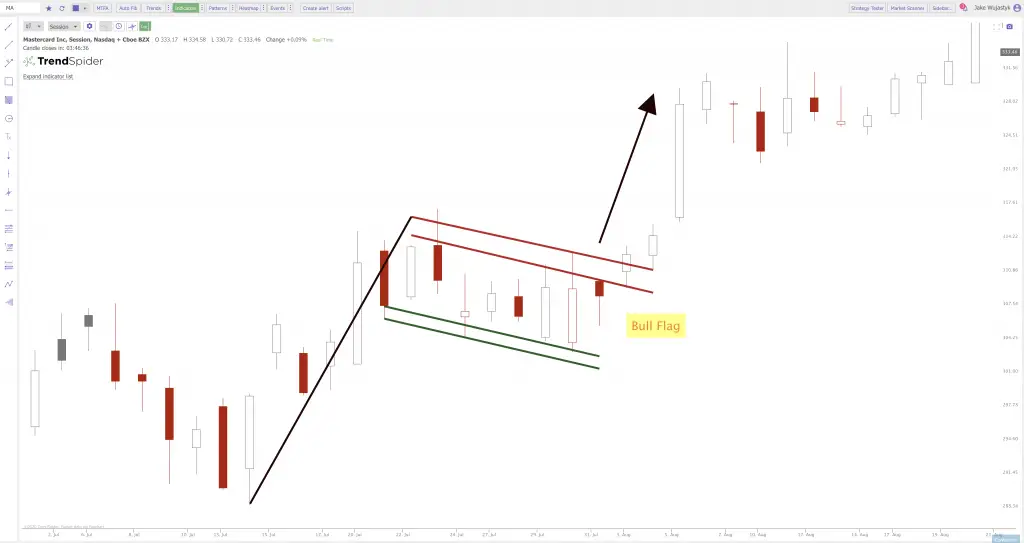
The below Mastercard chart shows a bullish flag pattern where the uptrend begins near $288 and trends upward to $314 to create the ‘pole’ of the chart pattern. Then the uptrend stalls and created the ‘flag’ as a pullback into a descending range. Price broke out at $310 over the upper trend line in the flag and then moved in a continuation of the trend to almost $368. The pole was a $36 move from the low to the high before the flag. After the breakout price ran another $58. This is an example of a bull flag moving a greater distance from the flag breakout than it did leading up to the flag.
You can read my full The Ultimate Guide to Chart Patterns book here.