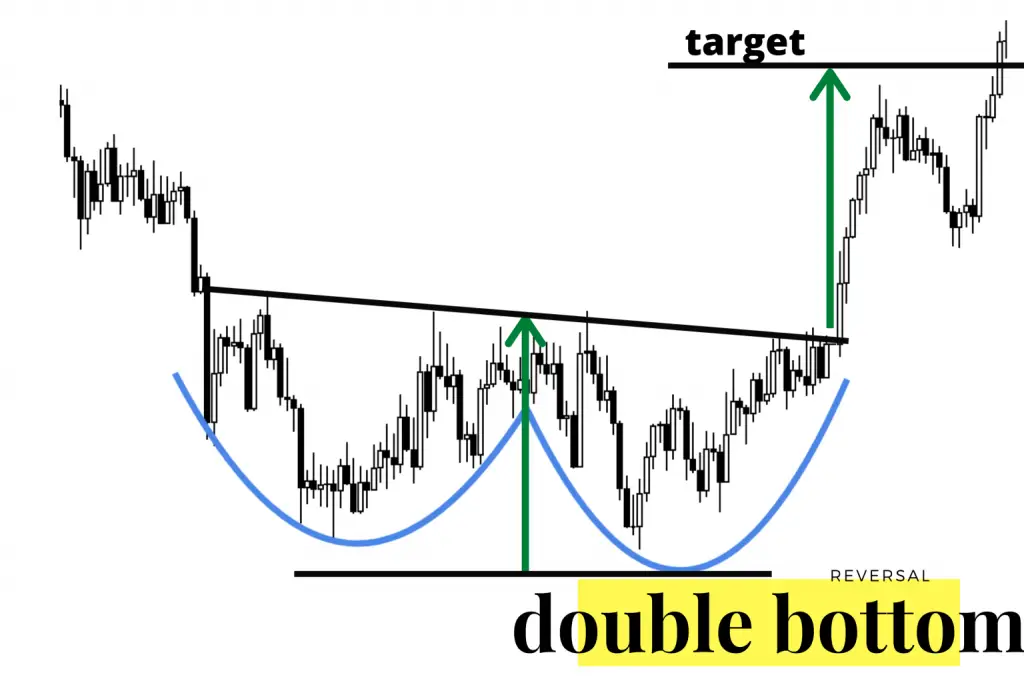
A W pattern is a double bottom chart pattern that has tall sides with a strong trend before and after the W on the chart.
The W chart pattern is a reversal pattern that is bullish as a downtrend holds support after the second test and rallies back higher. This pattern is created when a key price support level on a chart is tested twice with a rally between the two support level tests creating a visual W pattern on the chart. The W can be either rounded or have straight lines.
- A W chart pattern happens at the end of a downtrend that has likely gone on for weeks or months.
- The first bounce off support where price stops going down is the first support level.
- The first bounce and reversal in the downtrend is small and the short term run up is usually approximately 5% to 10% off the support lows on a daily chart time frame.
- The first rally off the lows fails and price returns to the previous support.
- The previous price support lows hold on the second test.
- The second test of support must be confirmed by a reversal and swing higher, it is only a potential pattern until support holds and price rallies off the support with higher volume and sometimes a gap up in price can happen.
- A breakout back over the high price that occurred in the middle between the double bottom support tests is a full confirmation of the W reversal pattern. This is the level where a signal to enter long can be given. Other traders will attempt to buy early as the second bounce off support happens. The early bounce can create a better risk/reward on entry but waiting until the middle resistance is broken confirms the new trend higher and increases the probability that the price will continue going higher.
- A double bottom chart pattern can take weeks and even months to play out with the middle rally resistance taking many different sizes and shapes.
Price action after confirming the double bottom can have a similar size height of the next right side trend as the previous trend on the left side of the trend before going sideways again. After a new price base at previous highs the uptrend can resume.
This article is a sample chapter from my book The Ultimate Guide to Chart Patterns.
