What does a moving average crossover generally signify?
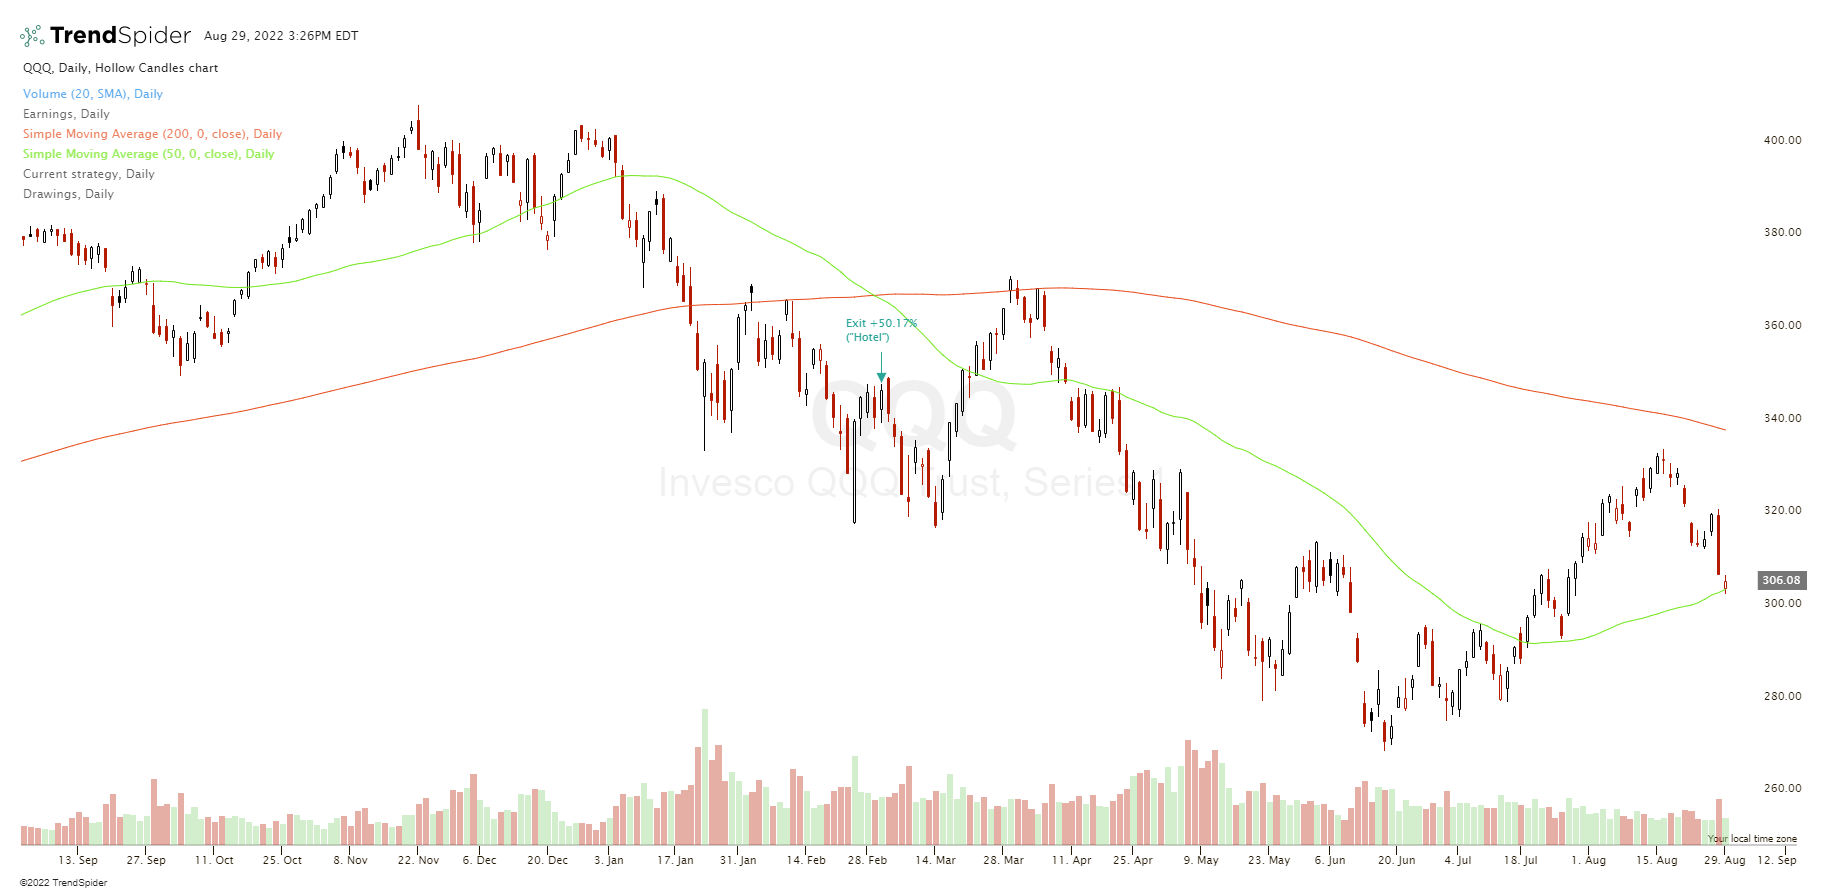
A moving average smooths out the price data to see the overall price trend. Ascending moving averages show uptrends and descending moving averages show downtrends in that time frame. Moving average crossover signals smooth out the volatility of just one moving average by filter one more level to the shorter one crossing over the longer one to confirm a trend is strong.
A moving average crossover signal is when you use both a short term moving average and a long term moving average on the same chart to signal your entries and exits in a mechanical way. These crossovers replace opinions, predictions, and forecasts with following the trend until the end when it bends.
A crossover signal is generated when the moving averages break above or break below each other. A trader buys when the shorter-term moving average crosses over the longer-term moving average and sells when the shorter-term moving average crosses back under the longer-term one.
Instead of price crossing over or under a single moving average as a signal the shorter-term moving average itself becomes the signal line as it crosses over the longer moving average. The best thing about moving average crossover signals is that they can capture trends and swings in price action while filtering out much of the volatility and noise.
Moving averages are trend filters. They may get in a late and get out late in a big trend but they capture the bulk of the move and have a a positive expectancy over time in charts that tend to trend historically.
Using backtesting software you can set up an entry signal for when a shorter-term moving average closes over a longer-term moving average. Then you can set up an exit signal for when the shorter-term moving average closes back under the longer-term moving average.
Backtesting can show you what worked in the past and has a high probability of working in the future. While a good backtest doesn’t guarantee future success a bad backtest almost assures failure. Backtesting can show you what doesn’t work and what will likely work along with the performance stats on what to expect for win% and losing streaks.
The power of a moving average crossover strategy in in the risk/reward ratio it creates by cutting losses and letting winners run. It has built in stop losses and trailing stops as it follows the path of least resistance. This moving average time frame can be used as an alternative to buy and hold investing and is a form of reactive trend following.
Now of all the moving average crossover signals the 50-day / 200-day is by far the most popular.
Is a moving average crossover a good strategy?
These two signals explained above backtest well on many charts. They are the most robust even beating buy and hold investing chart at the depths of bear markets and come out of them with more capital than just holding through a crash.
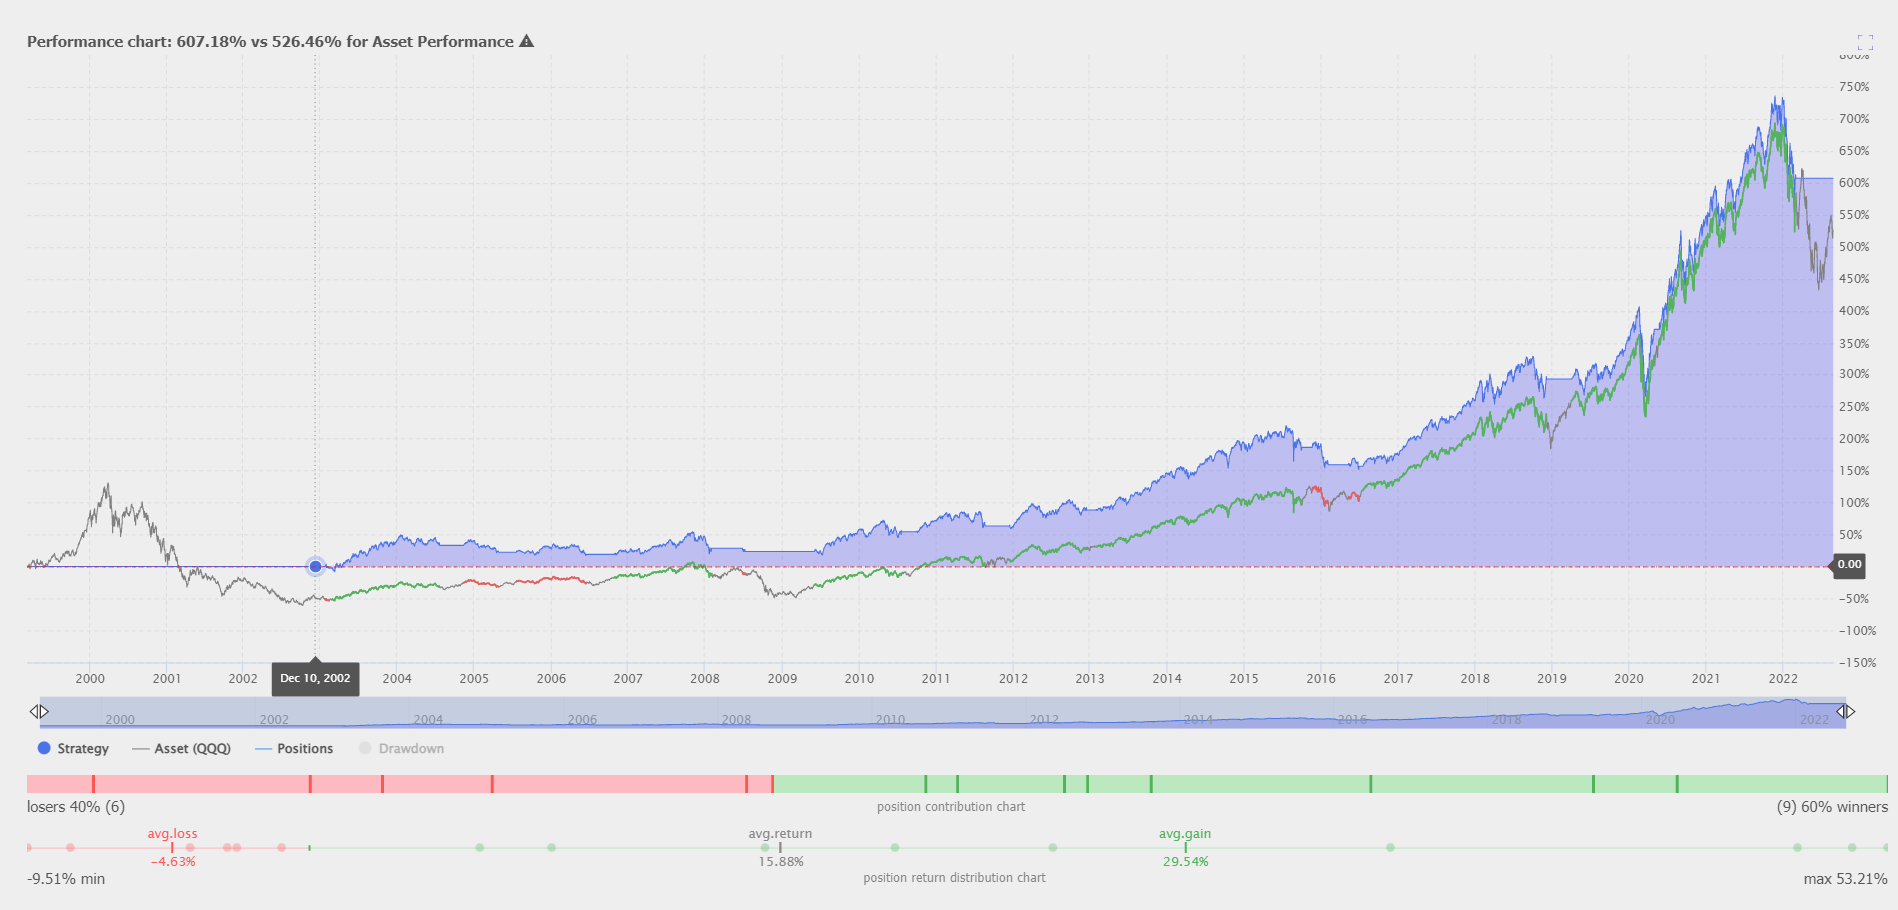
Let’s look at an example on the QQQ ETF chart using these two moving averages.


In the above example we can see that the crossover strategy outperforms the buy and hold strategy most of the time through going to cash in bear markets and staying long for the bulk of bull market run ups on QQQ which is very similar to the NASDAQ.
Now what if the 50-day / 200-day SMA crossover could be improved on by backtesting all the crossovers in that time frame on all the stocks in the S&P 500 index? Which crossover would be the best one backtested to outperform the even the Golden Cross and Death Cross and should be more closely watched?
Let’s take a look.
Best moving average crossover backtest results
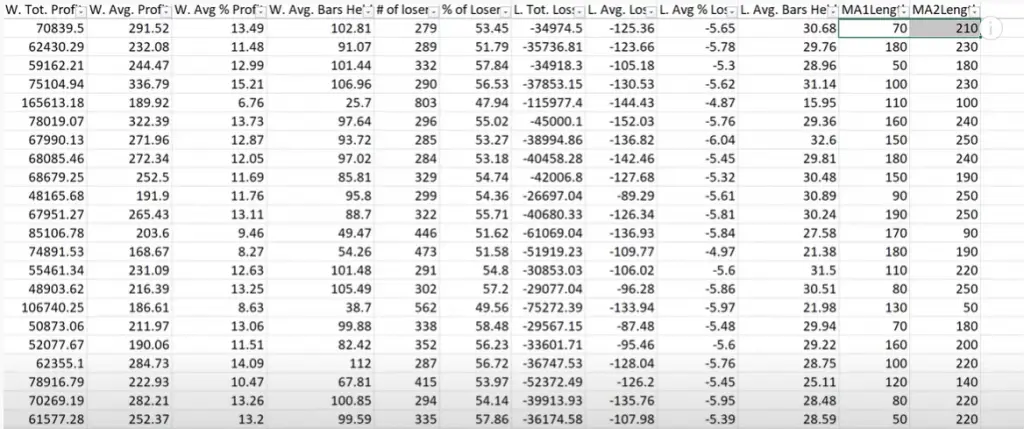
The Critical Trading YouTube channel ran backtests on all the stocks in the S&P 500 index on the longer time-frame around the 50-day to 250-day simple moving average range using Amibroker software. He looked for the best returns versus drawdowns from 2003 to mid 2021. The best longer-term backtested moving average strategy with the expanded range was found to be the 70-day / 210-day SMA crossover signal. If you are interested in the best shorter-term moving average crossover on a smaller time you can check out my previous article here.

He also explains how you can optimize these long-term moving average crossover strategies by managing the exit by using the longer signal moving average as a trailing stop after entry. This is something I have also recommended in my moving average books on Amazon and my eCourses on Teachable.
You can watch the entire video and process here:
If you are interested in a deeper dive into the study of moving averages and how they can be applied to swing trading and trend trading you can check out my educational resources below specifically about moving averages as technical indicators and tools for trade management.
Here are my four moving average books:
Here are my three moving average eCourses: