For price action traders, the movement of price itself is their primary signal for taking entries and exits. They let momentum, the trend, and movement filter their trading decisions.
A price action trading strategy is a process for using new incoming and evolving price action data to make buy and sell decisions on a watch list of charts. Price action trading attempts to use entry and exit signals that have an edge for creating good risk/reward ratios that lead to profitable trading with wins that add up to more than losses over time.
A price action trading process is the opposite of using opinions, predictions, and emotions to make trading decisions. Price action trading is the process of using what is happening in the market to determine whether you buy, sell, or hold a position. Pure price action is what can show the current behavior of buyers and sellers on any time frame. Listening to what is visually being expressed on a chart is the art and science of technical analysis,
There are four primary dynamics in price action trading:
- An entry signal based on a breakout, breakdown, trading range, or chart pattern.
- A stop loss set at the price level a trade should not go if it is going to work out.
- A trailing stop that moves up a stop loss to lock in profits if a winning trade reverses.
- A profit target on where a maximum reward will be locked in if the price level is reached.
Price action trading rules create a framework and context for a trader’s actions to keep them safe from ruin while pursuing profits.
Here are five of the most important price action trading rules that every trader should know.
1. Trendline Rules
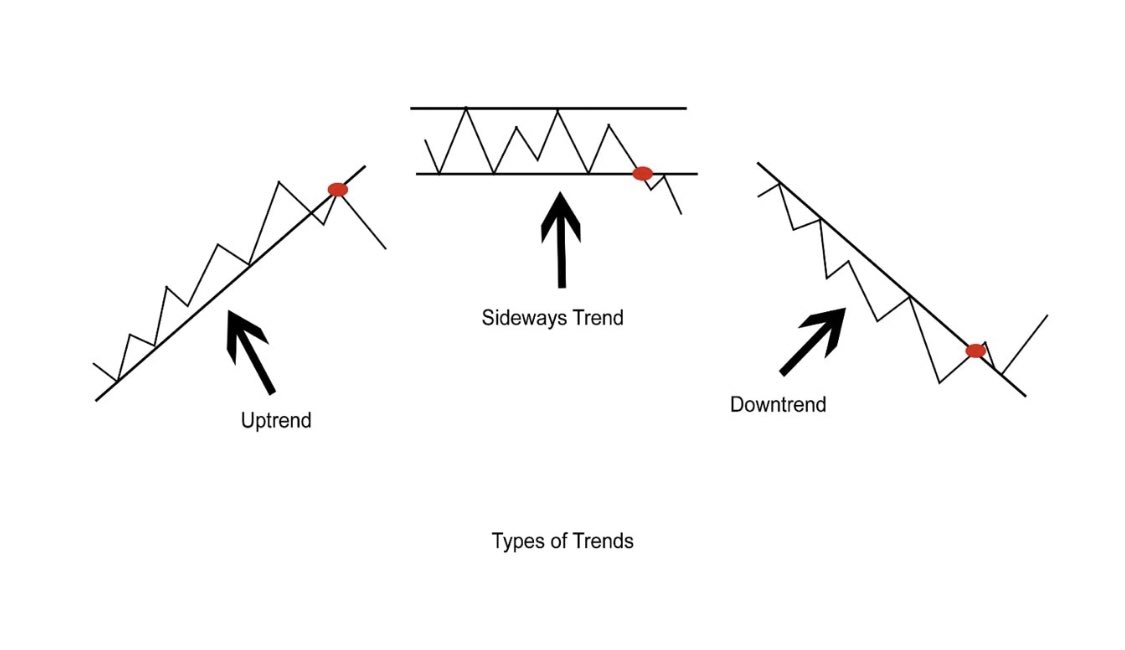
Trend lines are the identifiers and connectors of resistance and support in chart patterns.
Trend lines are identifiers of the trend in your trading time frame.
Vertical trend lines must be drawn from left to right to identify one of the following:
A trend of higher highs signaling an uptrend.
A trend of higher lows for support in an uptrend.
A trend of lower lows signaling a downtrend.
A trend of lower highs for resistance in a downtrend.
- Trendlines show the path of least resistance.
- After a trendline break a new extreme is created.
- Trendline breaks can signal a reversal in the current directional bias of a move.
- Trendline breaks can also signal a correction of the current move or that a new trend has begun.
2. Trading Range Rules
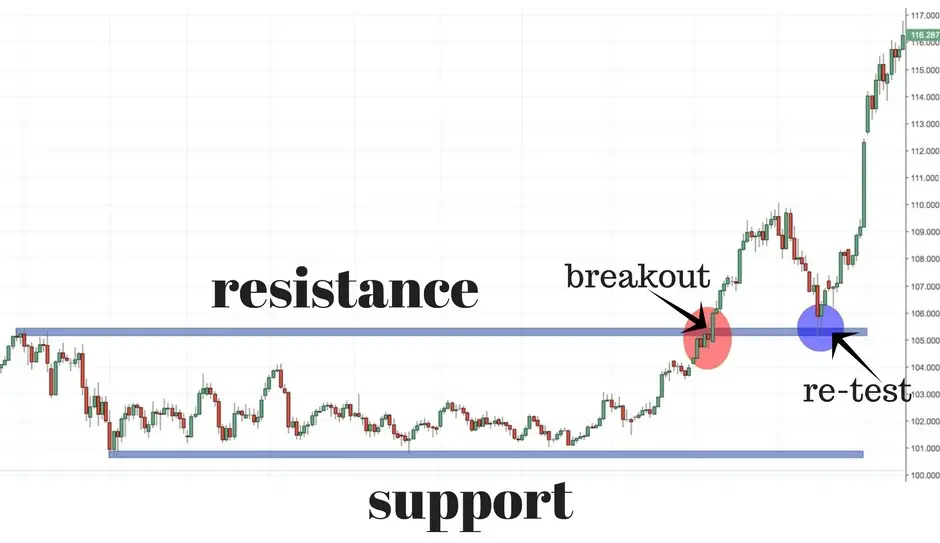
A range bound chart has a defined level of support where buyers come in at that price so it does not go lower there multiple times. A range bound chart also a defined level of resistance where there are no buyers above that price so it does not go higher there multiple times. A range bound chart starts to convert to a trend after price breaks above resistance or below support and starts to move away from the established price range. Buying support and selling resistance is rewarded on a range bound chart.
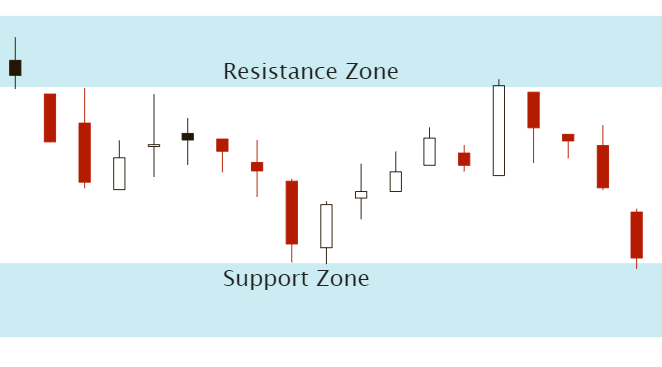
- Price action ranges show congestion between buyers and sellers.
- Most breakouts fail the first few times.
- Most breakouts pullback to the previous range before continuing in the direction of the breakout.
- Buy low sell high.
3. High Probability Setup Rules
A high probability entry point for taking a new position is simply when their is a higher probability of one thing happening over another next based on a signal.
Examples of these are buying dips in uptrends or rallies in downtrends. Entering a failed breakout of a range that fades back inside the previous resistance or support. Extreme oversold or overbought levels that move to extremes in deviations from the mean of the 20-day moving average. Finally, a breakout of a range and a new trend signaled by a new high or low over a specific time frame.
- Second chance entry points in the direction of the primary trend.
- Failed breakouts against the trend.
- Failed extreme moves at peaks and valleys.
- Confirmed higher highs or lower lows signaling a trend has begun.
4. Don’t Fight the Trend
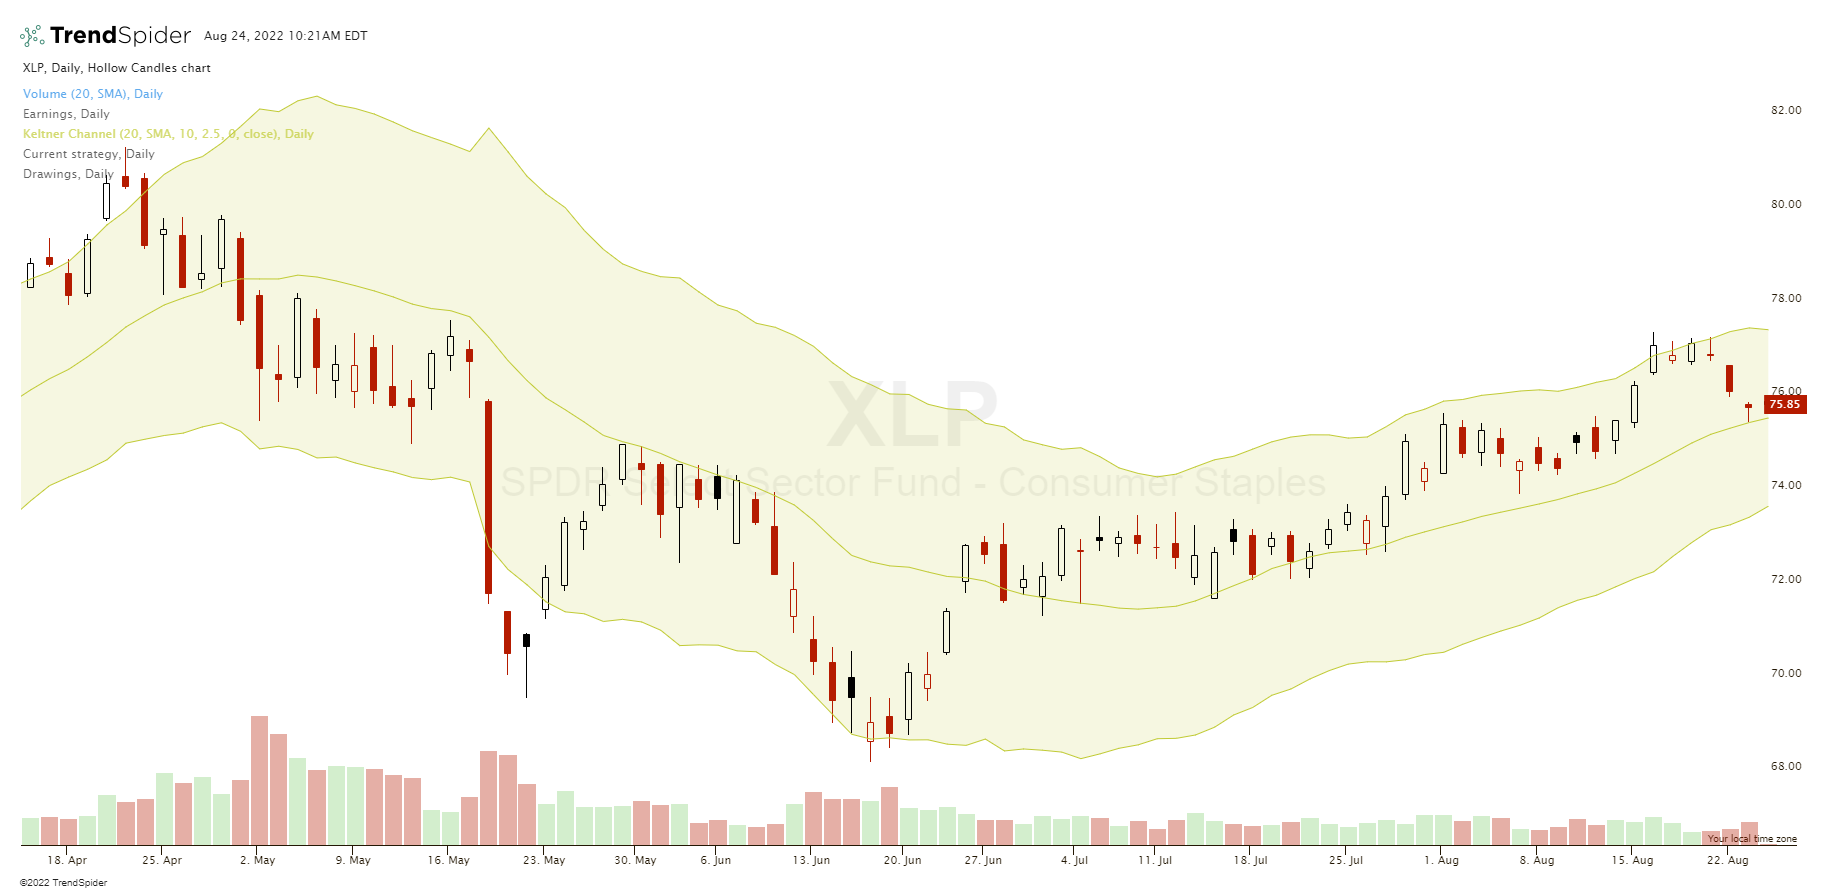
The most dangerous rule any trader can break is the rule to not fight the trend. Huge losses happen when a trader finds their self in a position on the wrong side of a trend and doesn’t take their stop loss and the small loss turns into a huge loss. Profitable traders stay with the path of least resistance, if they do take a counter trend trade after an extreme oversold or overbought level their position size is small enough and their stop loss is tight enough to exit with a managed loss when wrong.
- The market doesn’t have to reverse, it can keep trending.
- Picking tops and bottoms is a high risk low probability trading strategy.
- Trendlines show you the current trend regardless of your opinions or predictions.
- In bull markets thing long, in bear markets, think short.
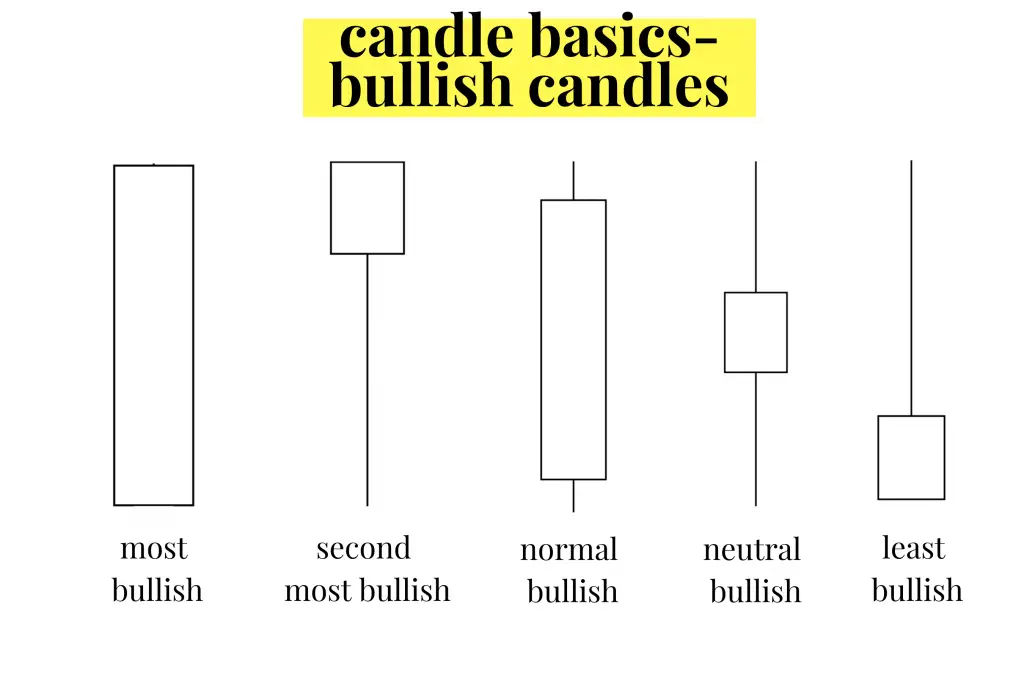
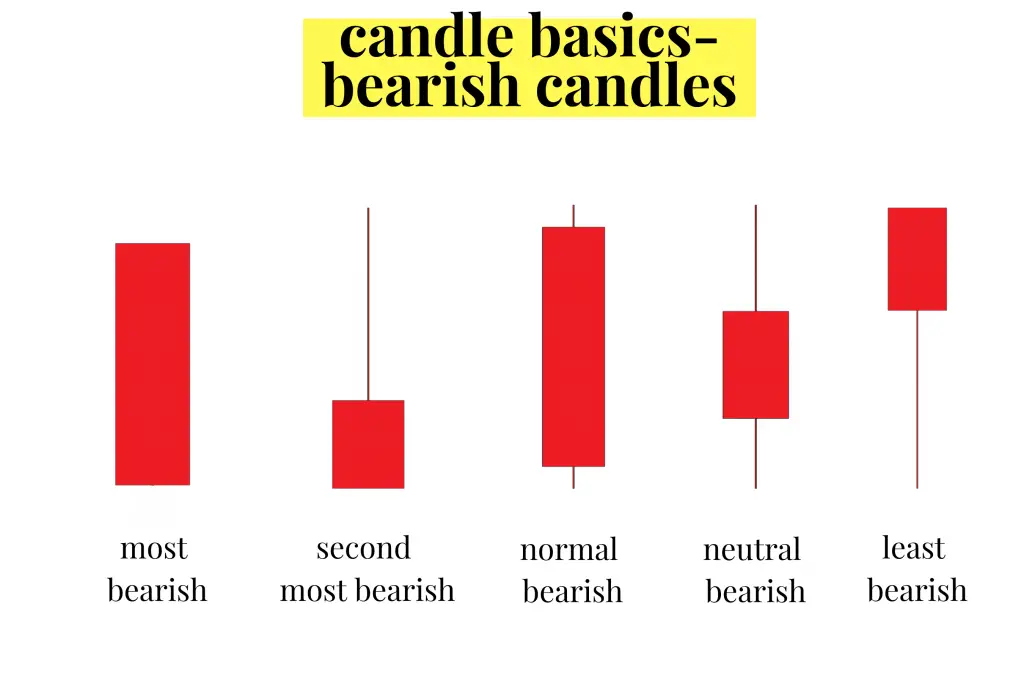
5. Signal Candle Rules
A candle that shows confluence with other technical indicator signals and setups increases the odds of success at entry. A bullish candle with a bullish moving average crossover confirms the signal. A bearish candle at an overbought reversal signal in the RSI conforms the odds of a move to the downside. A candlestick pattern can confirm another technical setup.
- Signal candles confirm momentum for setups.
- Bullish candles can confirm long signals.
- Bearish candles can confirm short signals.
- Most strong moves start with big candles in the direction of the signal.
These five price action trading rules can dramatically improve your trading when used in the right context consistently over time, they can be an edge.
If you’re interested in learning the principles of price action trading you can check out my best selling trading book Complete Guide to Price Action Trading on Amazon here and my other books on Amazon here.
I have also created trading eCourses on my NewTraderUniversity.com website here. My educational resources can save you both time and money in your trading journey.

