Symmetrical Triangle Pattern

Chart Facts:
- The symmetrical triangle is a neutral chart pattern that usually forms during a trend as a continuation pattern of the existing trend.
- Sometimes an symmetrical triangle pattern will form as a reversal pattern as a trend comes to an end, but they are usually continuation patterns of an existing trend
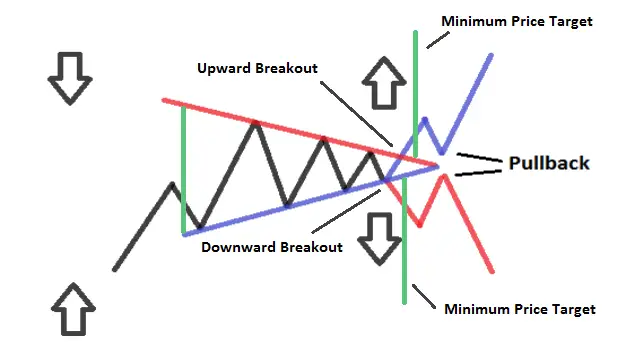
- When the descending and ascending trend lines converge the symmetrical triangle takes shape.
- A symmetrical triangle has a wide trading range at the beginning of the pattern and compresses to a very small range as the patter plays out.
- The symmetrical pattern creates a coil and contains at least two lower highs and two higher lows for a compression of the price range into an apex point.
- The lower highs is a sign of buyers losing interest for higher prices at the same time that higher lows show that sellers are not letting their position go at lower prices as the pattern makes higher lows at the same time it is making lower highs.
- The top descending resistance line on this pattern trends downward at the same time that the lower support line trends up with higher lows.
- Symmetrical triangle patterns can be longer in timeframe and wider in range than the similar pennant pattern but is usually longer in duration than a pennant.
- Many times volume will contract as the pattern gets near to its apex. A breakout with higher than average volume can give a higher rate of success for a buy signal.
- As a symmetrical triangle expands and the trading range shrinks, volume should start to decline. This can be a compression in price action before a break out.
- Traditionally the price projection for this pattern after the breakout is found by measuring the longest distance in the price range of the pattern and projecting after the resistance breakout.
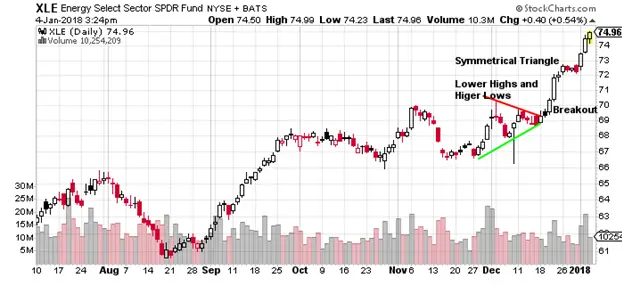
This $XLE chart below shows a symmetrical triangle after a 3 month trading range. Unlike the pennant chart pattern it did not follow an uptrend. This triangle could have broken either way but the break out of the apex as the two trend lines met was upwards and followed through for a trend form the break out at $69 to $75. The high of the triangle was near $70 and the low was near $67 so a target of a $3 move would have been a good goal. This pattern doubled that for a great gain.

Chart Summary: The symmetrical triangle is a neutral chart pattern with resistance at the top descending vertical trend line that is making lower highs and support at the ascending vertical trend line that is making higher lows. A breakout of the descending trend line near the apex of the converging trend lines is the signal which can be a bullish or bearish entry signal based on the direction of the break out. A stop loss could be set for if price returns and closes on the other side of the apex of trend line convergence. The gain if the pattern breaks and trends could be equal to the size of the largest area of the trading range inside the pattern. A price target could be for a run after the breakout equal to the largest point of the trading range inside the triangle.