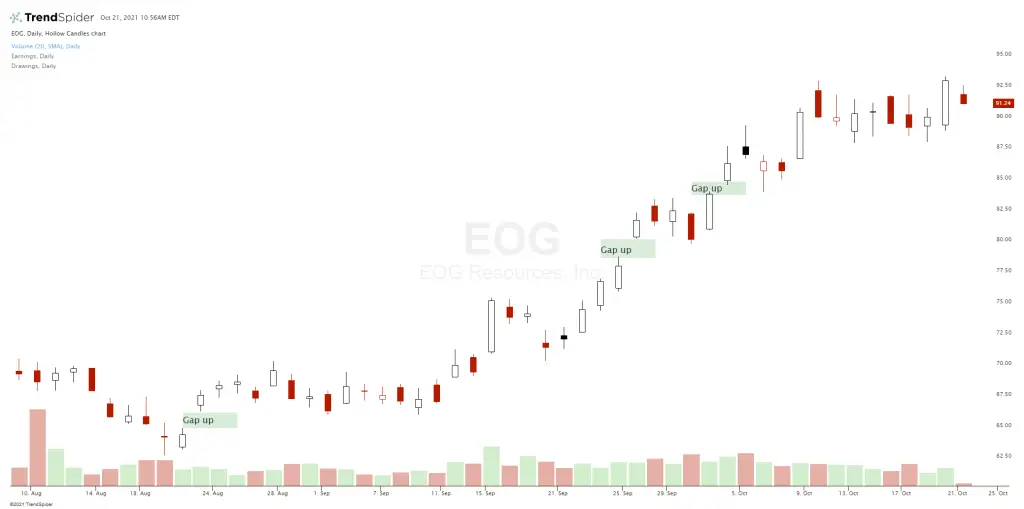
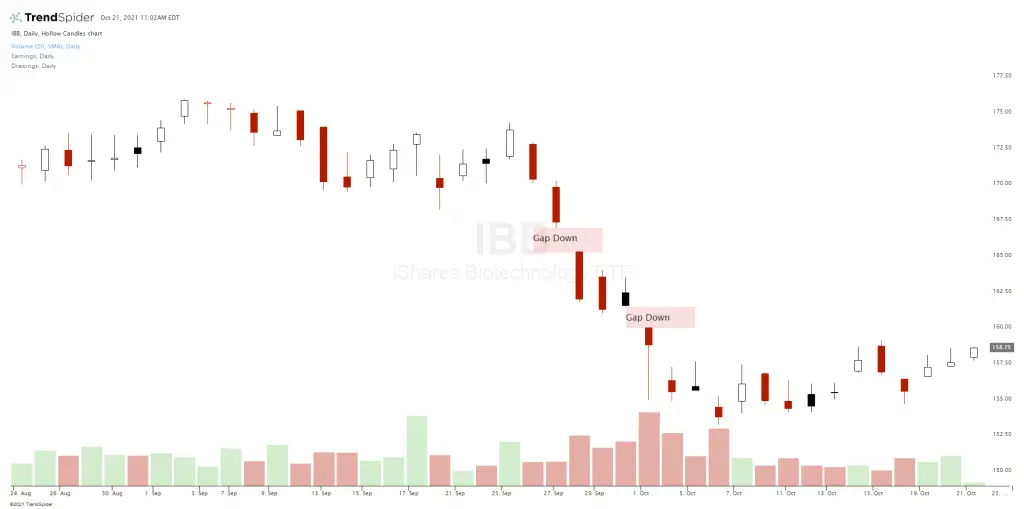
A gap in stocks is when a chart skips over levels of prices and starts trading higher or lower than the last candle without a direct path through all previous prices. Gaps on charts are momentum signals in technical analysis in the direction of the gap. On an intraday chart if an opening gap versus the previous day’s close in price is not filled in the first hour of trading it generally continues to move in the direction of the gap for the rest of the day.
If price closes at $95 on one candle and then opens trading higher at the next candle at $100 then that is considered a gap up in price.
If price closes at $95 on one candle and then opens trading lower at the next candle at $90 then that is considered a gap down in price.
A gap in price on a stock chart shows the absence of traders over a sequence of prices where no buyers or sellers agree to trade. A gap shows an absence of interest around a price range that is simple skipped by the next buyers and sellers. Most gaps in price action are caused by news events, earnings, or new economic data. A gap is created as buyers and sellers try to price the new information into a chart.
Gap ups in price can be very bullish on average but other technical context must be considered like previous resistance levels or an overbought reading. A gap up outside any previous trading range is the most bullish as their is no previous supply of stock to overcome.

Gap downs in price can be very bearish on average but other technical context must be considered like previous support levels or an oversold reading.

A gap fill occurs when price action returns inside the previous gap area to close in the empty zone in a chart. All gaps are not closed immediately but most are closed eventually but most are indicators of the direction of the short term price action in the direction of the move until that gap is filled. If price action stays in a trading range after a gap and moves back inside the opening the odds are that it will back fill the previous gap. If the next candle after the gap is outside the gap candle and continues moving away from the gap then it signals a continuation and good odds of a swing or trend continuing in the direction of the gap in price.