Stock Market Cycle Chart
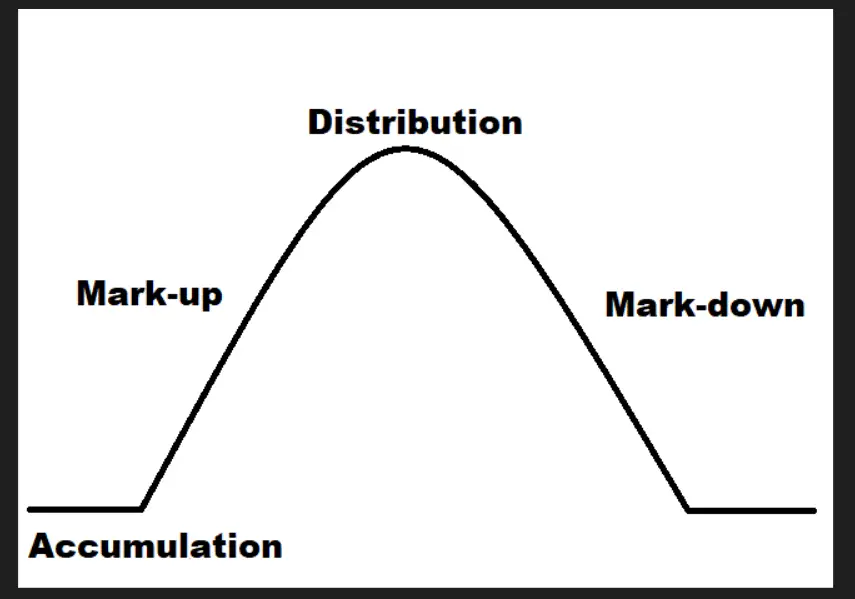
Market are always changing from sideways price action, to uptrends, to volatility, and to downtrends. Markets go through cycles of accumulation, mark-up, distribution and mark-down. Having a strategy to trade based on the market phase can be an edge in investing and trading. At least knowing what phase the market is in can also help avoid big losses. Each chart whether a stock, index, currency, commodity, and crypto can be undergoing its own phase at any time.
Accumulation Phase
This is usually the first phase in a market cycle as it happens after a market bottom when the first dip buyers, value investors, and money managers begin to buy and hold positions in the market. These early buyers are people that believe that the worst is over and lows will not be revisited, they believe the bear market or downtrend will be ending soon. At these price levels stock market valuations are attractive or at least fair, stocks are still a little oversold, and the market sentiment is still overall bearish.
Financial media, publications, the news, and social media are still very negative and believe the worst is not over. Late in this phase the sentiment starts turning from bearish to neutral.
This phase is generally sideways action inside a trading range with decreasing volatility.
Mark-Up Phase
This is the primary phase of a bull market as volatile decreases and price begins to trend higher. More buyers begin to come in as hope and optimism comes into the market and people begin to make profits. Trend followers, momentum traders, and growth investors begin to buy the breakouts to higher prices in the stage of the cycle. Sentiment switches and turns bullish for the chart and asset class.
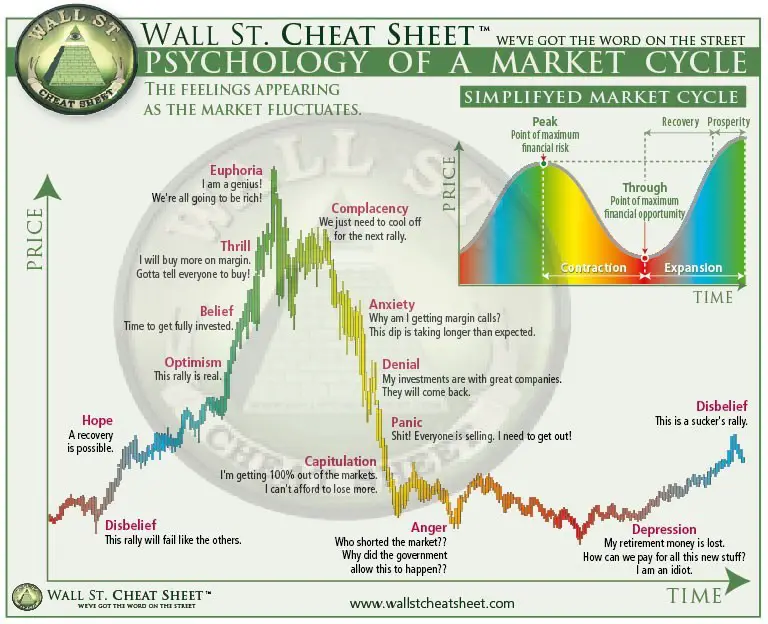
Financial media starts to report the worst is over and how economic conditions are improving. Fear of missing out and greed become the new emotion driving buyers into the market as the uptrend goes higher.
This phase continues on higher volume until the market because overbought technically and overvalued fundamentally. It eventually evolves into the greater fool theory where people are only buying to sell later at higher prices with no long term holding ambitions. The later buyers come in at this phase the higher the risk versus the reward.
The last part of this phase in the cycle is a parabolic run up and blow off top on huge volume.
Thrill and euphoria are the last emotions experienced by traders and investors before the end of the mark-up phase and top is put in.
This phase is an uptrend in price action with higher high and higher lows and low volatility until it ends.
Distribution Phase
In this third phase of the market cycle, big sellers begin to exit with their profits stealthily. Investors start selling to lock in profits as their stocks become overvalued versus where they bought them at. Traders begin reaching their profit target in price or their trailing stop losses are triggered to lock in profits as prices fall lower.
Down days in price begin to happen on more volume than up days. Volatility begins to slowly increase. Price action stops moving higher and settles into a trading range. Market sentiment turns from bullish to mixed or neutral.
A bearish pattern will form on the chart like a head and shoulders or a double top. At the end of this phase the market begins reversing direction from and uptrend to sideways before the downtrend begins.
During the distribution phase traders and investors think the uptrend will eventually resume but become disappointed as rallies are sold into.
This is the market phase where if profits are not locked in they are lost permentantly.
This phase begins to grow more volatile as price stops making new highs and begins to get choppy in a wide range.
Mark-Down Phase
This final phase in a market cycle punishes long positions and can cause large losses in a short amount of time. Indexes can fall lower than -20% during this phases, speculative stocks can fall -50% or more, and cryptocurrencies can fall -70%. This is not unusual to happen during any market cycle.
Mark-down phases can be very volatile with big rallies that fail to follow through higher. This is the downtrend phase of a market cycle where shorting strength can be profitable and short positions can make money.
This market phase is dominated by short sellers and people that want to get out of their positions with any chance they get. It is so difficult for a chart to trend higher in this phase because so many holder are trapped at higher prices and sell to get back to even at any opportunity.
The quality of a stock and the fundamental value doesn’t matter during this phase as bear markets are like hurricanes that sink all ships regardless of their quality. Money managers must sell to raise capital as investors start withdrawing capital.
This phase is a volatile downtrend with lower highs and lower lows that has strong bounces but continues to make new lows in price. This is the bull market end game and the beginning of a bearish stock market drop of over -20% from the peak price.

