Candlestick charts, originating from Japan over 300 years ago, have become an essential tool for traders worldwide. They provide valuable insights into market sentiment and potential price movements. This blog post delves into the basics of candlestick charts, common patterns, their analysis in context, and practical tips for trading using these charts. By the end, you will have a solid foundation to apply candlestick chart analysis to your trading endeavors.
Basics of Candlestick Charts
Anatomy of a candlestick chart
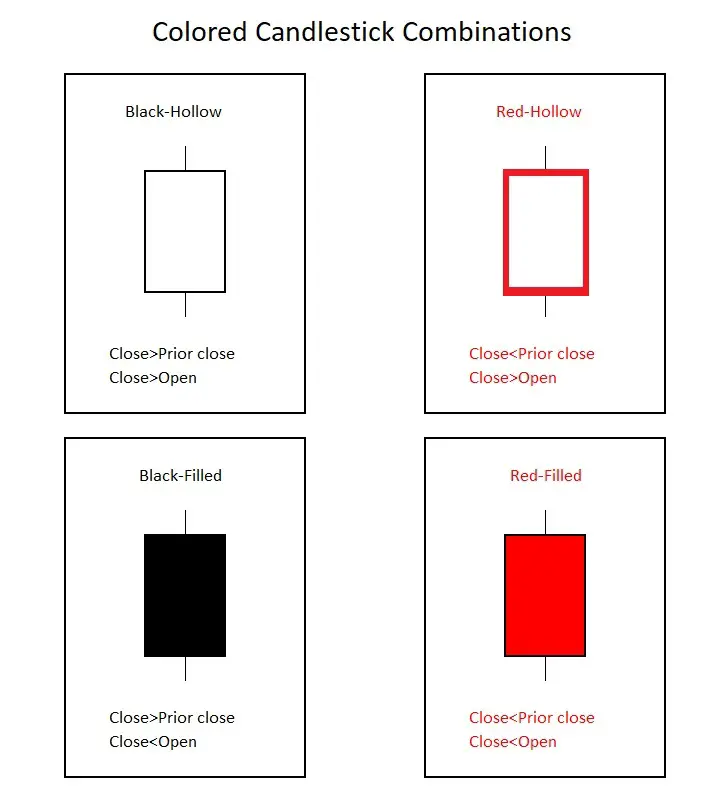
A candlestick comprises three main parts – the body, upper wick, and lower wick. The body represents the price range between the opening and closing prices, while the wicks signify the highest and lowest prices within a specific timeframe. Typically, a green or white body indicates a bullish candle (closing price higher than the opening price), and a red or black body signifies a bearish candle (closing price lower than the opening price).
Timeframes
Candlestick charts can be customized to display various timeframes, such as daily, hourly, or even minutes. The chosen timeframe determines the duration represented by each candlestick. For example, in a daily chart, each candlestick represents one trading day.
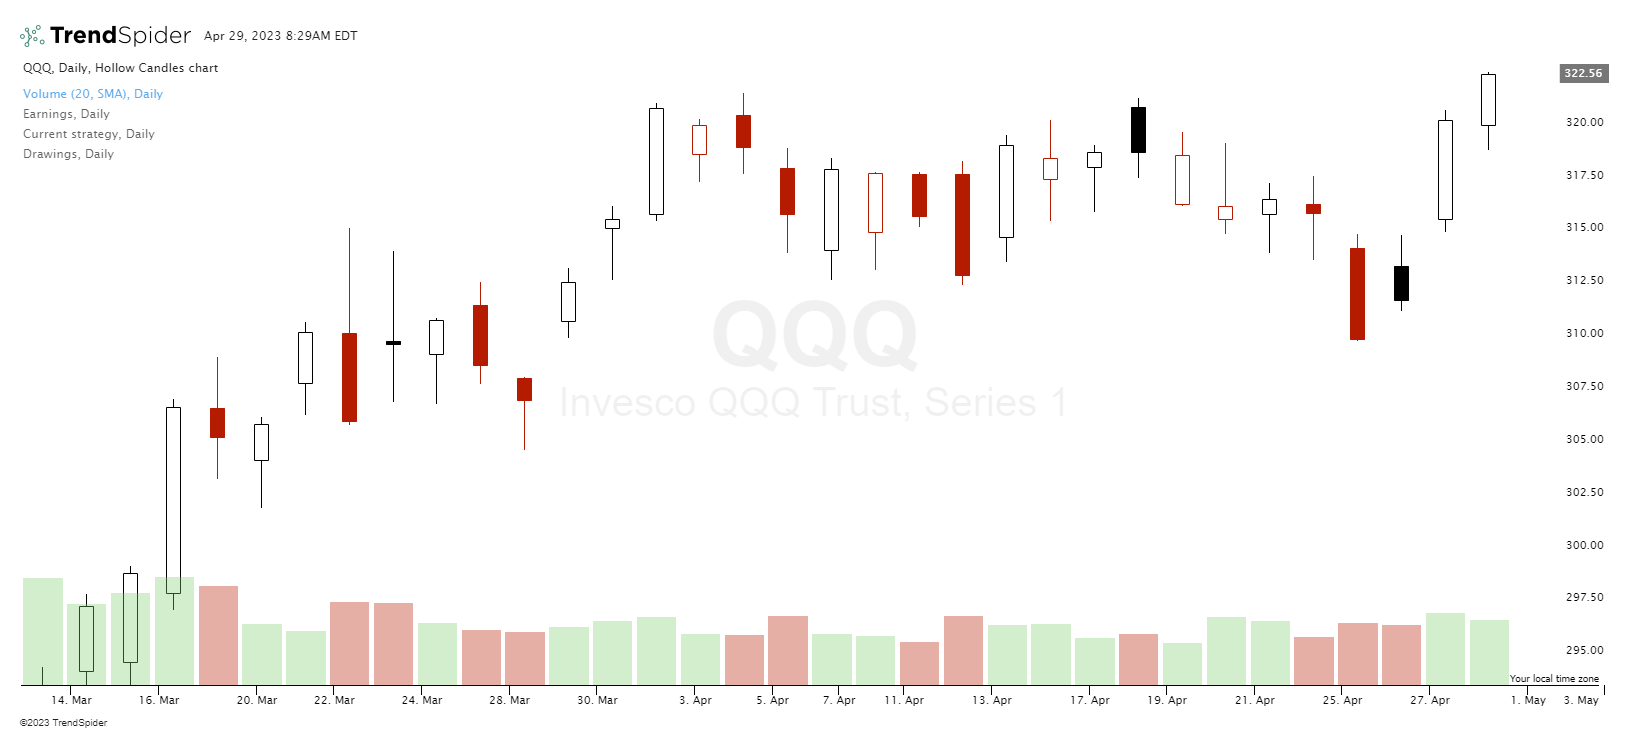
Chart courtesy of TrendSpider.com
Price movement interpretation
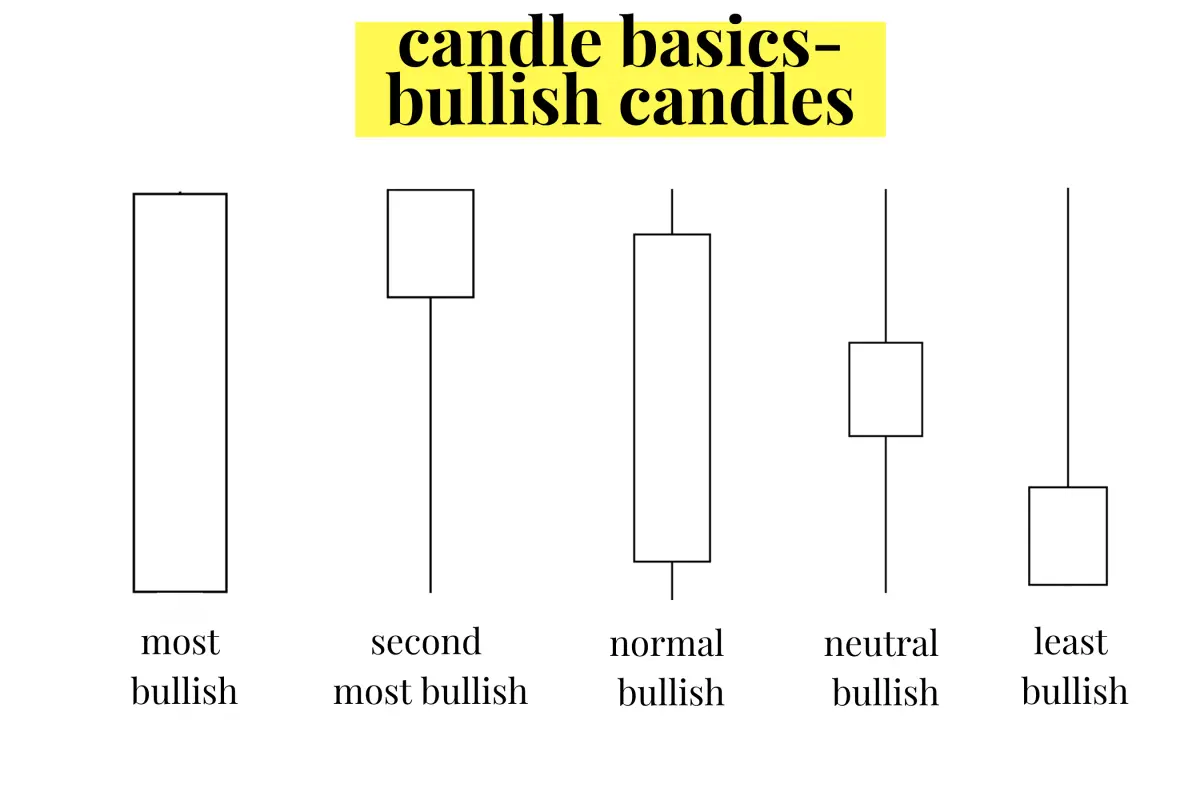
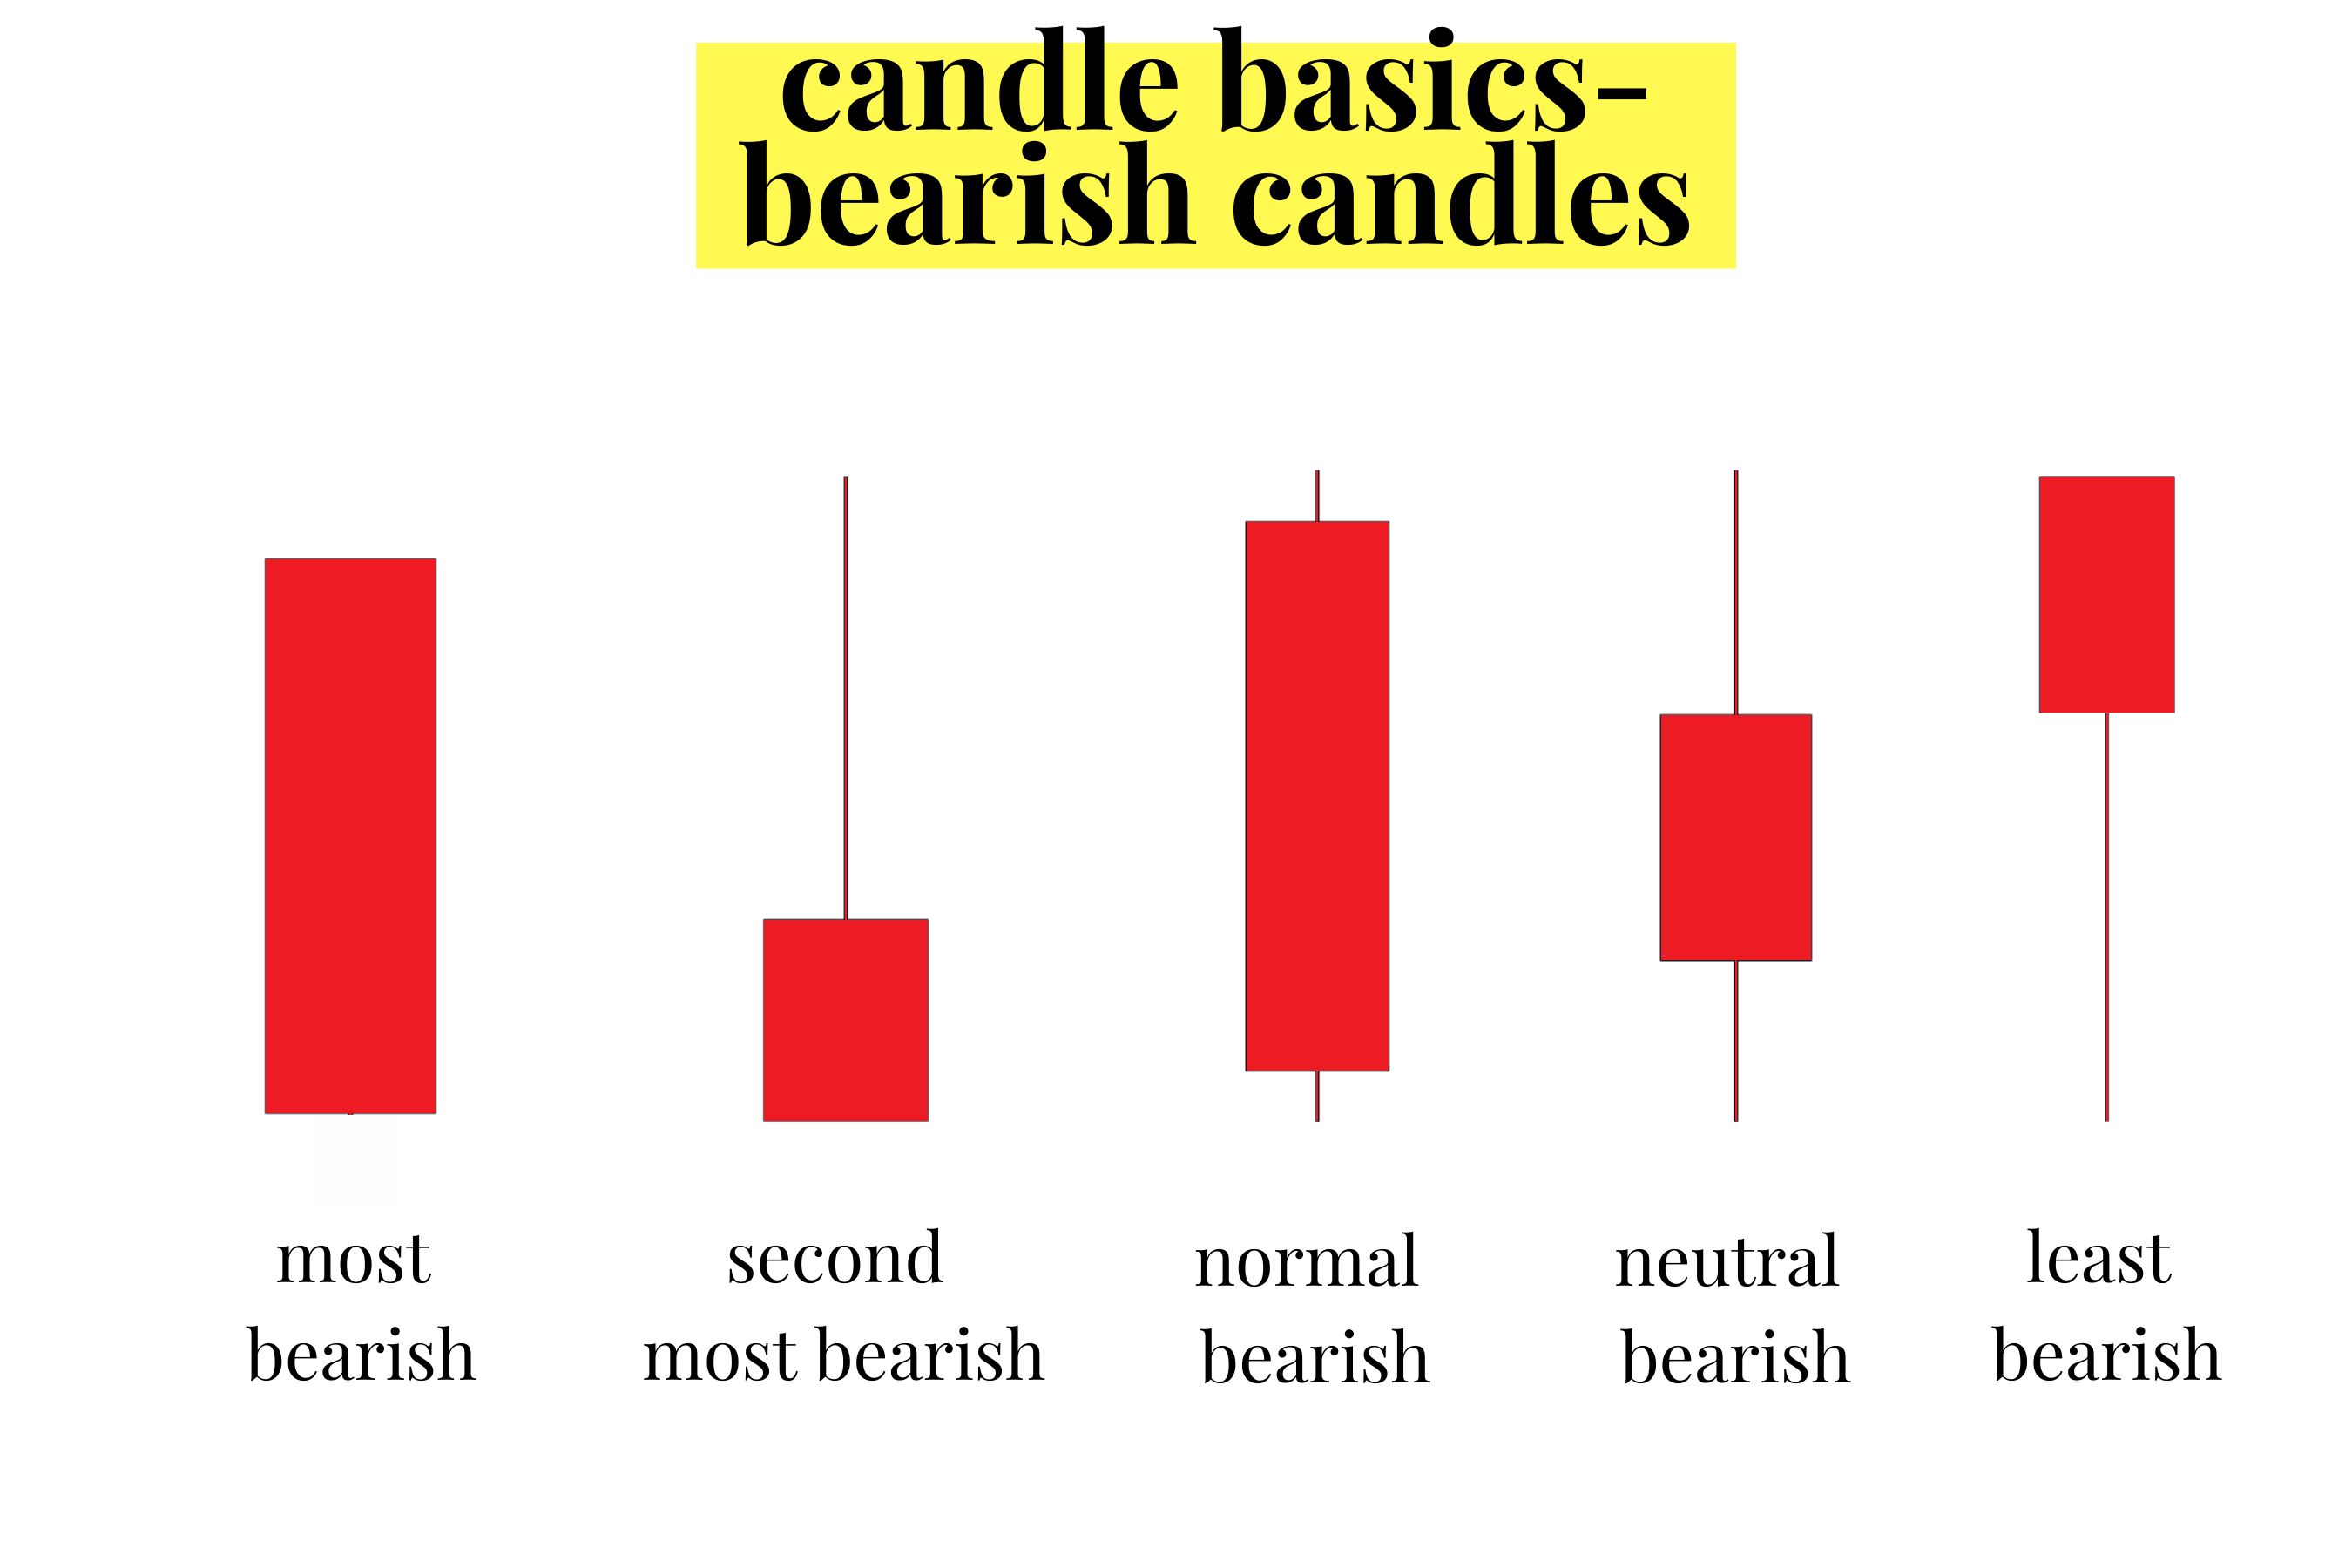
Candlestick charts help traders identify price trends and potential reversals. The body’s size and the wicks’ length provide clues about the strength of the bulls and bears during a particular timeframe. A long body with short wicks usually indicates strong buying or selling pressure, while a small body with long wicks suggests indecision and potential trend reversal.
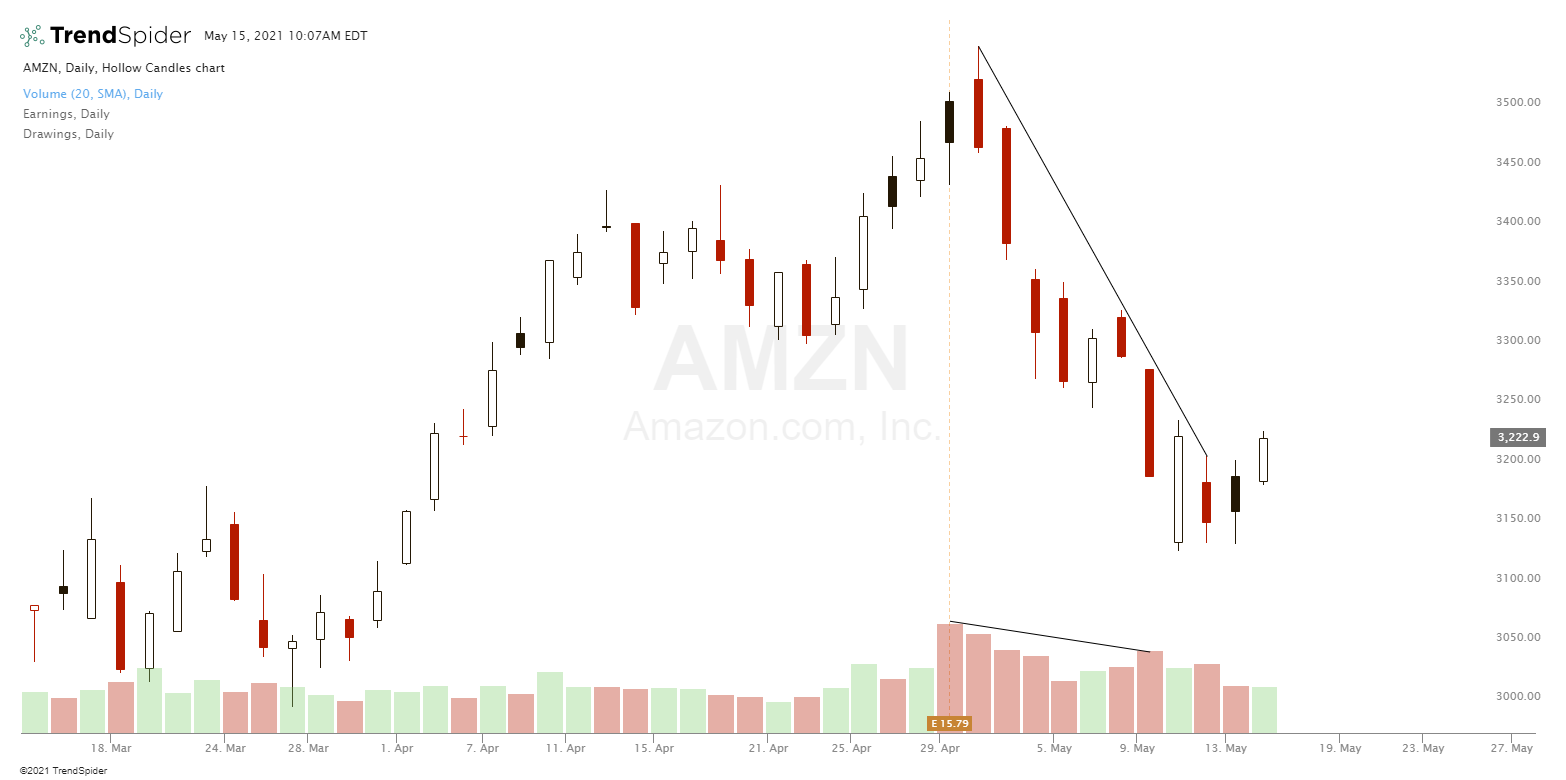
Hollow-candlestick guide:
Bullish candlesticks that closed higher than the previous day’s close and higher than the open are white.
Bearish candlesticks that closed lower than the previous day’s close and lower than the open are red.
Bearish candlesticks that closed lower than the previous day’s close but lower than the open are black.

Common Candlestick Patterns
Bullish and bearish patterns
Candlestick patterns can be categorized as bullish (price likely to rise) or bearish (price likely to fall). These patterns help traders make informed decisions about entering or exiting a trade.
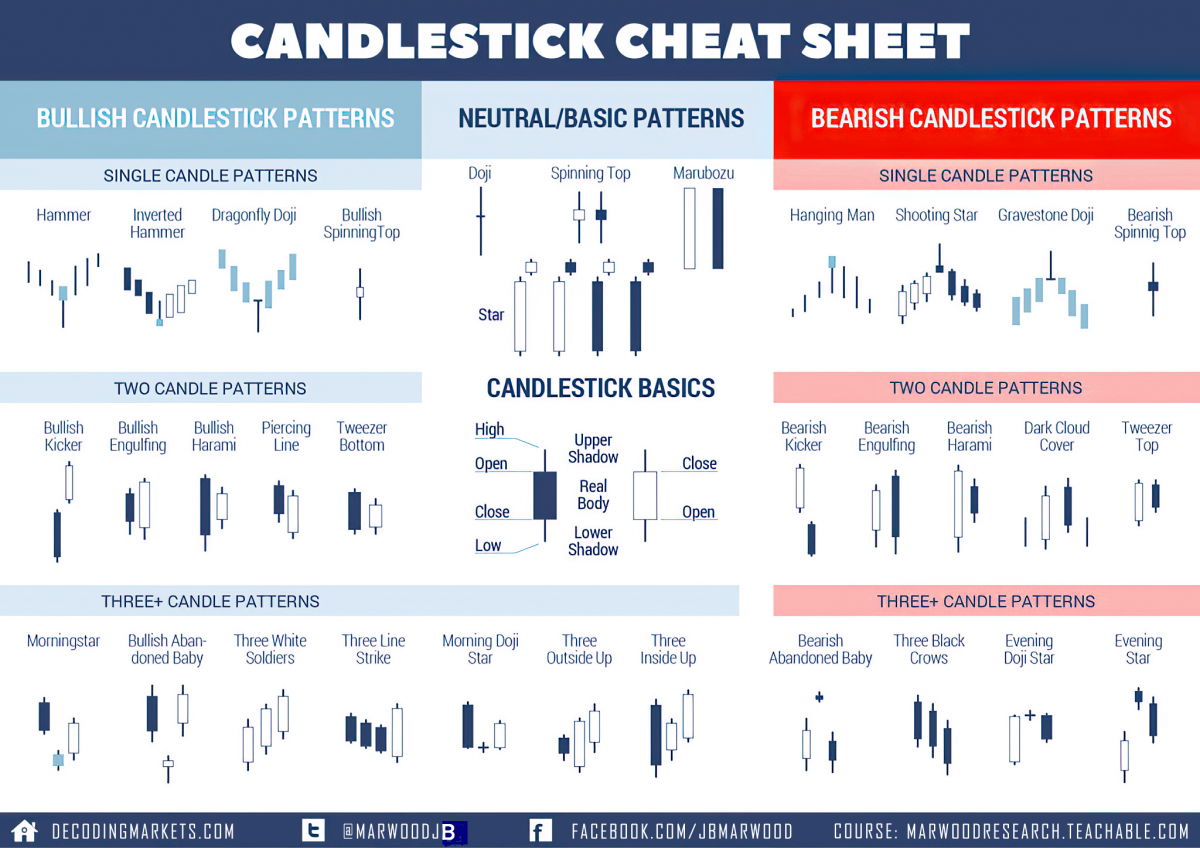
Image courtesy of StockSoftResearch.com
Single, double, and triple candlestick patterns
Candlestick patterns can be further classified as single, double, or triple patterns based on the number of candlesticks involved. Here are some popular examples:
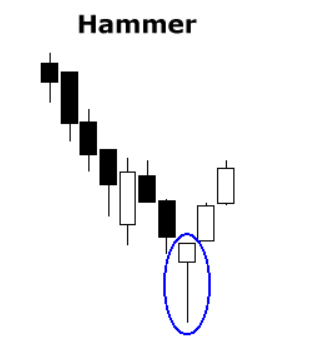
- Hammer (single, bullish): This pattern occurs at the end of a downtrend and has a small body with a long lower wick, indicating that bears initially pushed the price down, but bulls regained control and pushed the price back up.
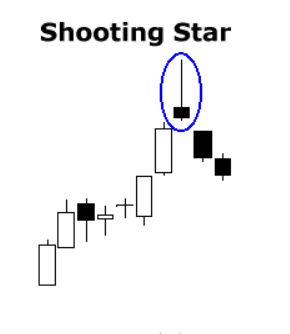
- Shooting Star (single, bearish): Similar in appearance to the Hammer but found at the end of an uptrend, the Shooting Star has a small body with a long upper wick, signaling that bulls initially pushed the price up, but bears took over and pushed the price back down.
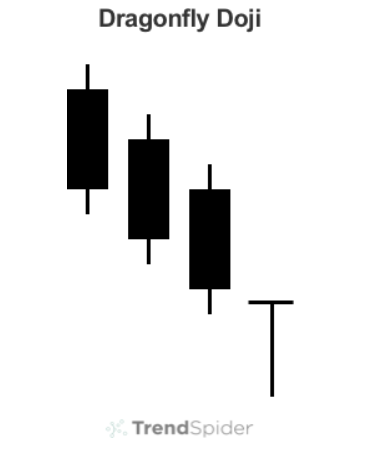
- Doji (single, neutral): A Doji has a small or nonexistent body, indicating that the opening and closing prices are nearly equal. This pattern suggests indecision in the market and can precede a trend reversal.
Analyzing Candlestick Patterns in Context
Support and resistance levels
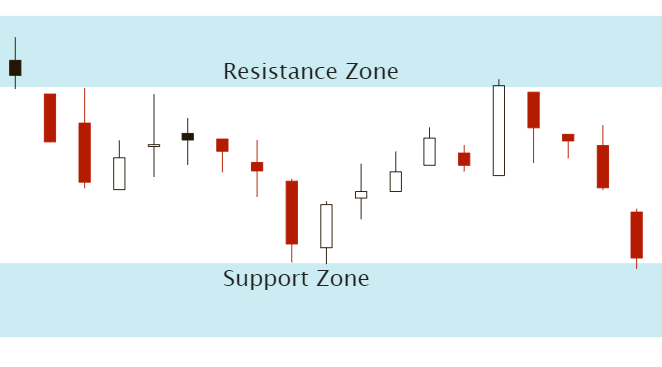
Support and resistance levels are horizontal lines that indicate where buying or selling pressure is likely to halt price movement. Candlestick patterns that occur near these levels can provide stronger trading signals.
Trendlines and channels
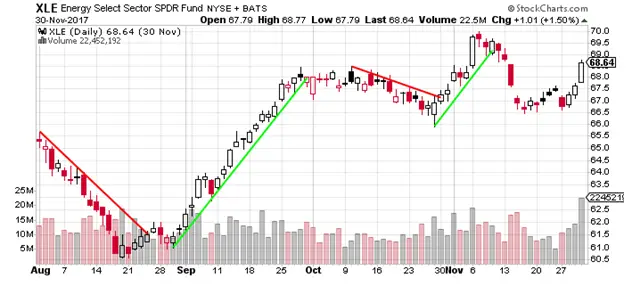
Trendlines are diagonal lines drawn to connect two or more price points, indicating the direction of a trend. Channels are parallel trendlines that act as boundaries for price movement. Analyzing candlestick patterns in the context of trendlines and channels can help traders make better predictions about potential price movements.
The significance of volume
Volume refers to the number of shares or contracts traded within a specific timeframe. A high volume indicates a strong interest in a particular asset, while a low volume suggests a lack of interest. Analyzing volume in conjunction with candlestick patterns can help confirm the strength of a trend or the likelihood of a reversal.
Combining Candlestick Patterns with Other Technical Indicators
Moving averages
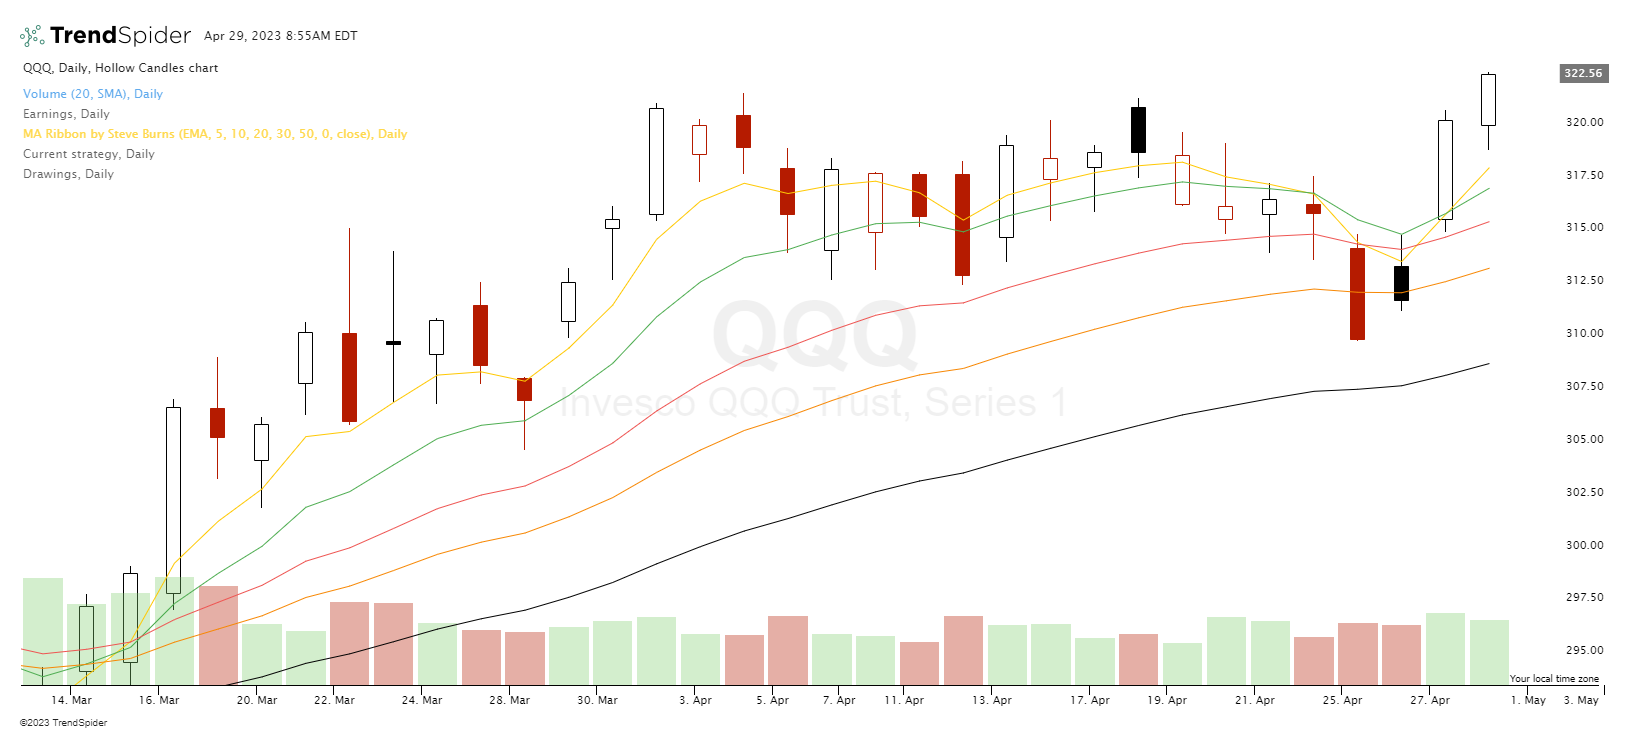
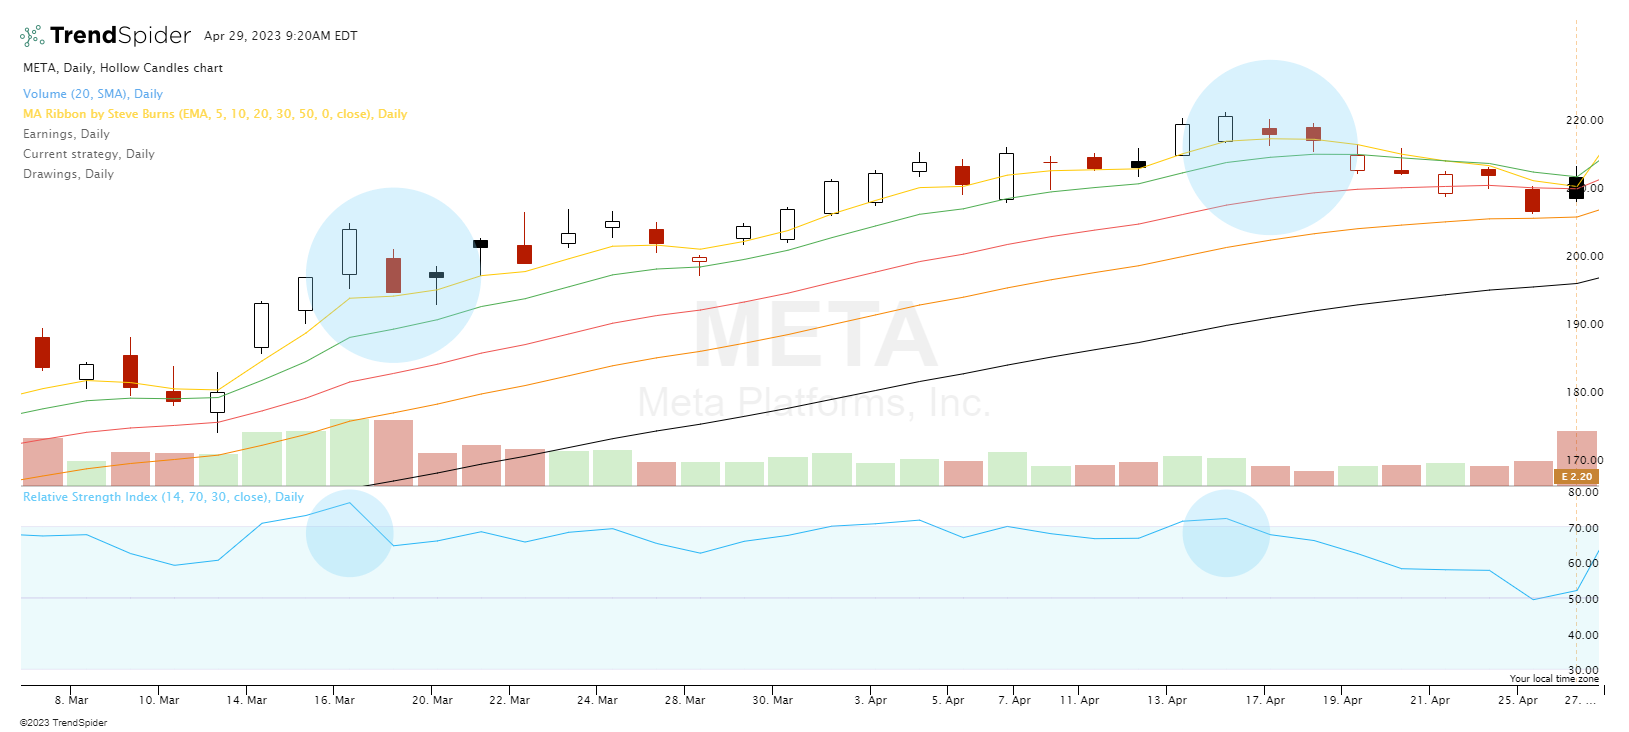
Moving averages smooth out price data to help identify trends. The two most common types are the Simple Moving Average (SMA) and the Exponential Moving Average (EMA). By combining candlestick patterns with moving averages, traders can better understand market sentiment and make more informed decisions.
Relative Strength Index (RSI)
The RSI is a momentum oscillator that measures the speed and change of price movements, indicating overbought or oversold conditions. When candlestick patterns coincide with RSI signals, traders can increase the probability of successful trades.
Bollinger Bands
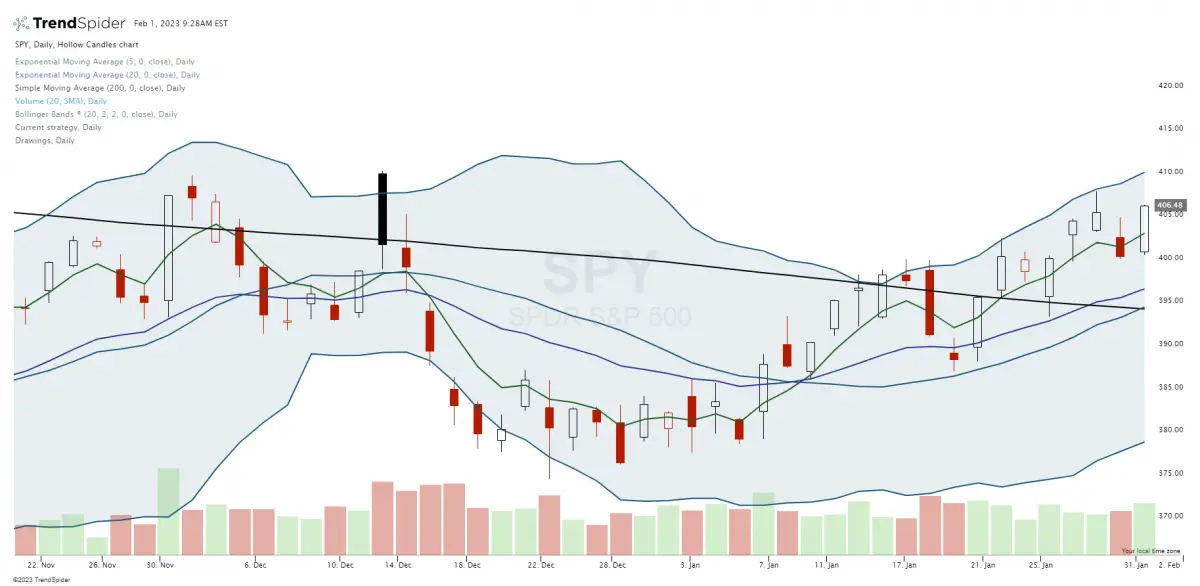
Bollinger Bands have a moving average and two standard deviation lines above and below. They help identify periods of high and low volatility and potential reversals. Combining candlestick patterns with Bollinger Bands can provide valuable insights into market conditions and potential trading opportunities.
Practical Tips for Trading with Candlestick Charts
How do you trade with candlestick patterns?
Trade management is essential to successful trading, especially when using candlestick patterns. It involves managing risk, setting appropriate stop-loss and take-profit levels, and monitoring trades to make informed decisions. Here are some steps to use trade management effectively when trading with candlesticks:
- Understand the candlestick patterns: Familiarize yourself with various candlestick patterns and their signals. Some common patterns include bullish/bearish engulfing, hammer, shooting star, doji, and morning/evening star. Understanding these patterns will help you identify potential trading opportunities.
- Assess the trend: Analyze the overall market trend before entering a trade. Candlestick patterns are more reliable when they align with the prevailing trend or signal a clear and apparent reversal of that trend. Trading in the direction of the trend increases the probability of success. Trading the turning points can also create a good risk/reward ratio. Both must be identified for the best probability of success.
- Determine support and resistance levels: Identify critical support and resistance levels on the chart, as they can act as potential entry and exit points. Support represents a price level where buying pressure exceeds selling pressure, while resistance is the opposite.
- Set stop-loss orders: A stop-loss order helps minimize losses if the trade goes against your expectations. Set stop-loss levels based on the candlestick pattern and the prevailing market conditions. For example, when trading a bullish engulfing pattern, you can place a stop-loss below the low of the engulfing candle.
- Establish take-profit targets: Set realistic price targets based on the pattern, trend, and key support and resistance levels. For example, if you’re trading a breakout from a resistance level, you could set your take-profit target at the next significant resistance level.
- Use appropriate position sizing: Determine the trade size based on your account size and risk tolerance. This will help you manage risk effectively and avoid significant losses.
- Monitor the trade: Monitor your open trades and adjust stop-loss and take-profit levels as needed. These factors set your risk/reward ratio and determine if the trade is worth taking. Look for any changes in market conditions or the emergence of new candlestick patterns that may require you to reevaluate your trade.
- Employ trailing stop-losses: To maximize gains, consider using a trailing stop-loss. This type of stop-loss order moves with the market, locking in profits as the price stops moving in your favor. You can use a specific price retracement or percentage-based trailing stop or base it on technical indicators like moving averages.
- Maintain a trading journal: Document your trades, including entry and exit points, stop-loss and take-profit levels, and the rationale behind your decisions. Reviewing your journal can help you identify patterns in your trading behavior and the markets and help make improvements over time.
Following these steps, you can use trade management to minimize losses and maximize gains when trading with candlestick patterns. Remember that successful trading requires discipline, patience, and a willingness to learn from wins and losses.
Risk management
Proper risk management is crucial for successful trading. Traders should never risk more than a small percentage of their trading account on any single trade, regardless of how promising a candlestick pattern may appear.
Trading psychology
Emotions can significantly impact trading decisions. Traders should cultivate discipline and patience, avoiding impulsive decisions based on fear or greed. Sticking to a well-developed trading plan can help maintain emotional balance and lead to more consistent results.
Case Studies: Successful Trades using Candlestick Charts
In-depth analysis of real-life examples
By examining real-world examples, traders can better understand how candlestick patterns work in different market conditions. These case studies can help identify opportunities and avoid false signals, increasing the chances of successful trades. Studying the history of charts to find reoccurring patterns is at the core of successful candlestick trading to identify the candlestick patterns and confluences with other technical indicators that give the best chance of success in the future.
Resources for Further Learning and Practice
Books, online courses, and webinars
Numerous resources are available to help traders continue learning about candlestick chart analysis, including books, online courses, and webinars. Investing time in education is essential for long-term success.
Trading software and platforms
Several trading software programs and platforms offer advanced charting tools, including candlestick charts. Practicing on these platforms can help traders become more comfortable with candlestick chart analysis.
Online communities and forums
Joining online communities and forums allows traders to exchange ideas, discuss strategies, and learn from experienced professionals in the field.
Conclusion
Candlestick charts are a powerful tool for traders, providing valuable insights into market sentiment and potential price movements. By understanding the basics of candlestick charts, recognizing common patterns, and applying them with other technical indicators, traders can make more informed decisions and increase their chances of success. Remember, practice and continued learning are vital for long-term success in trading.
