What is RSI in Stocks?
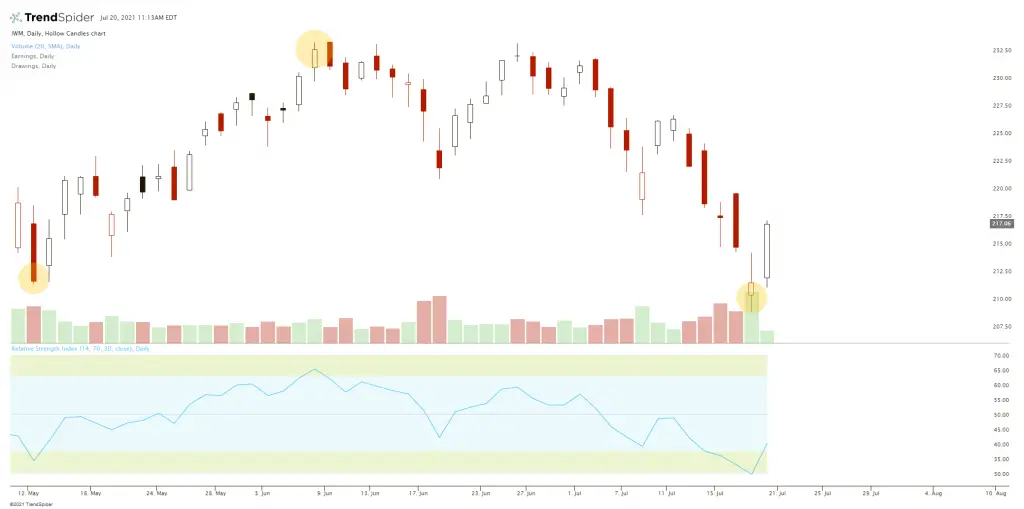
The RSI indicator buy and sell signals are based on oversold and overbought conditions on a stock chart. The RSI is a measurement of price moving too far and too…
Helping Traders Thrive
The RSI indicator buy and sell signals are based on oversold and overbought conditions on a stock chart. The RSI is a measurement of price moving too far and too…
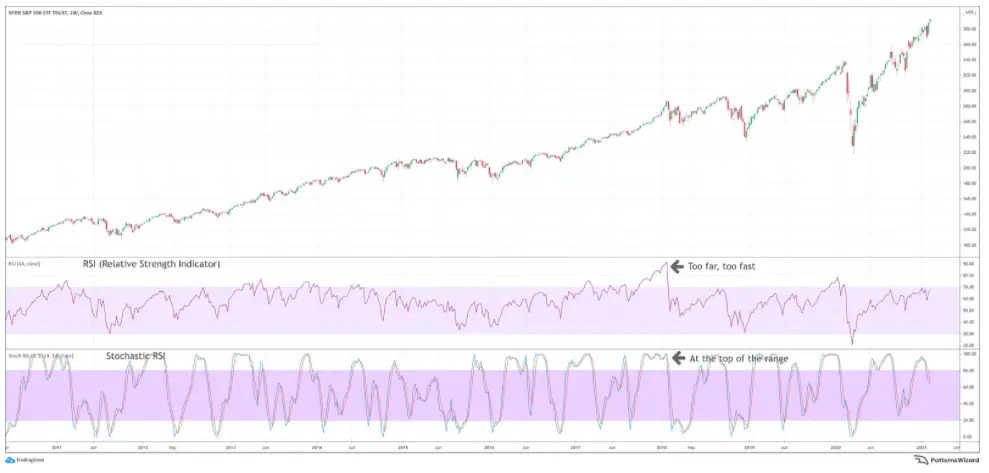
The following is a guest post from @PatternsWizard of PatternsWizard.com What is the Relative Strength Index (RSI)? RSI is a technical indicator used in technical analysis that helps to gauge the…
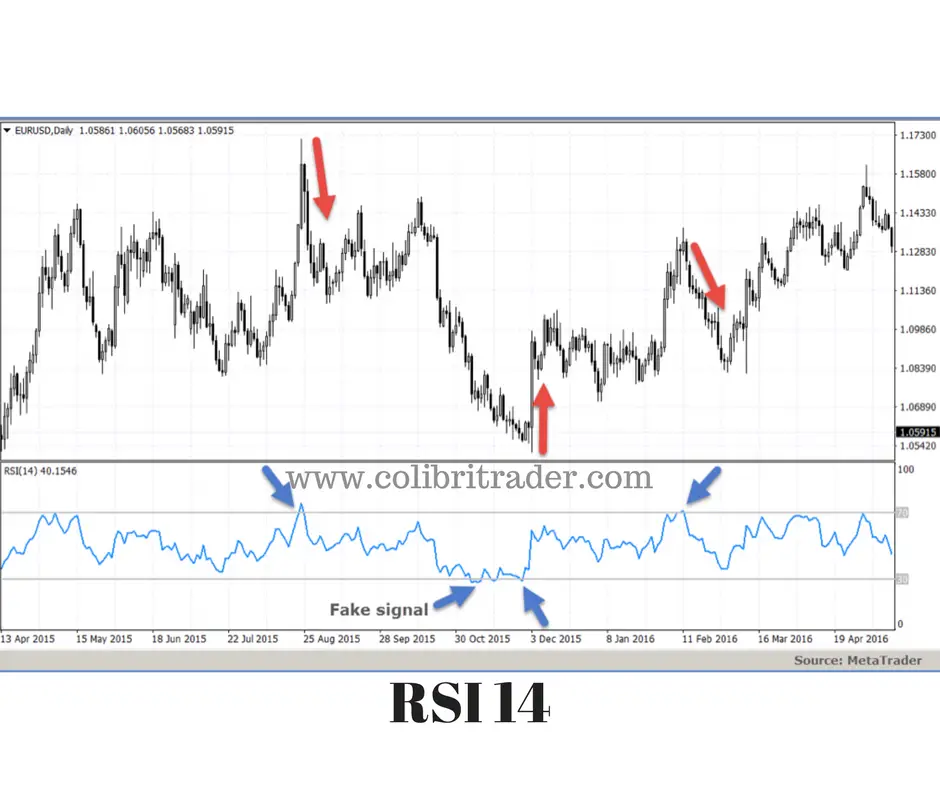
The RSI (Relative Strength Indicator) is a is a momentum oscillator that measures the speed and change of price movements. The RSI moves in a bounded range between zero and 100.…