One of the main things that make TrendSpider unique to other platforms is the ability to overlay charts from other timeframes onto a single chart. In this User Guide post, we take a look at how to use multiple timeframes in your analysis when using the TrendSpider charting platform.
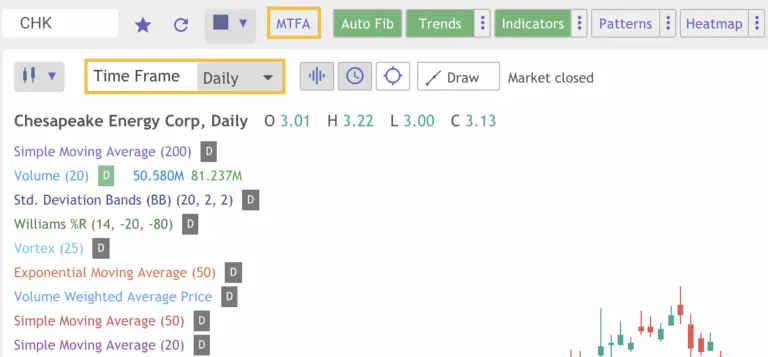
Step One: Click the “MTFA” button.

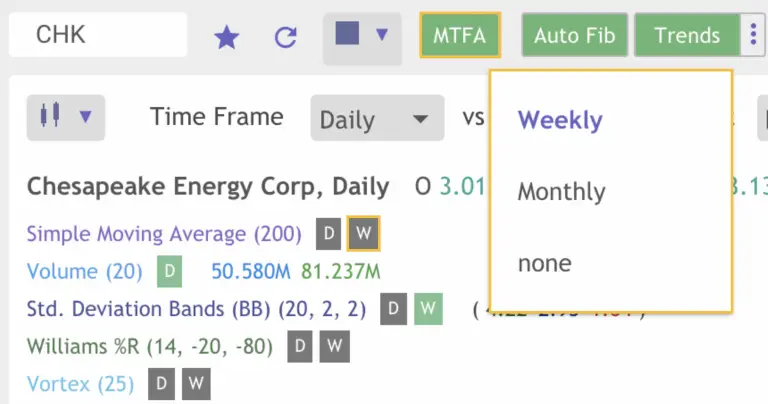
Step Two: Choose which timeframe you would like to compare.

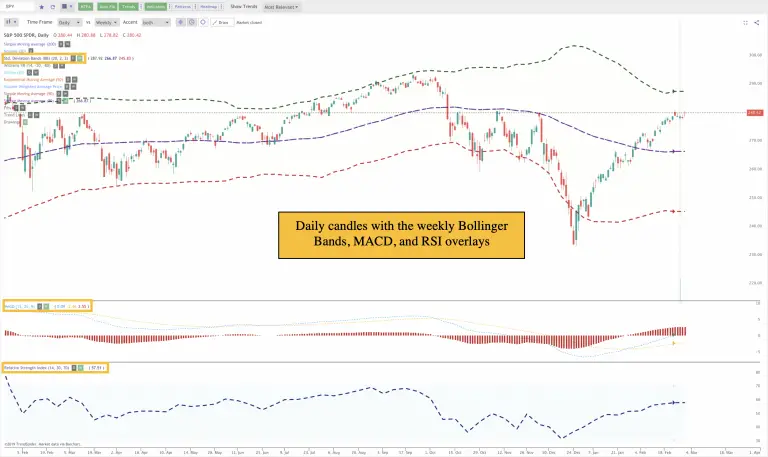
Step Three: Choose which features you would like to overlay (trendlines, Fibonacci levels, upper indicators, lower indicators).

TrendSpider is a new type of charting platform designed to help active traders make smarter trading decisions by automating the grunt work they normally do by hand. It is the first (and only) charting system to offer a fully-customizable automation engine and patent-pending dynamic price alerts on indicators, trendlines and complex multi-conditional criteria on top of a charting system. Through these features and others, TrendSpider helps active traders find better trade setups, faster, with greater accuracy, while improving their trade timing. Here is the like to check this charting service out-> https://www.trendspider.com/
You can also follow them on Twitter here-> @TrendSpider
This post is not investment advice it is for informational purposes only.
