This is a Guest Post by Jake @TrendSpider.
On Raindrop Charts, the color of a Raindrop depends on the relative position of the Left and Right mean (VWAP) prices to each other. The logic is similar to Japanese Candlesticks or Bars: It’s red if Right is less than Left, and green if Right is greater than Left.
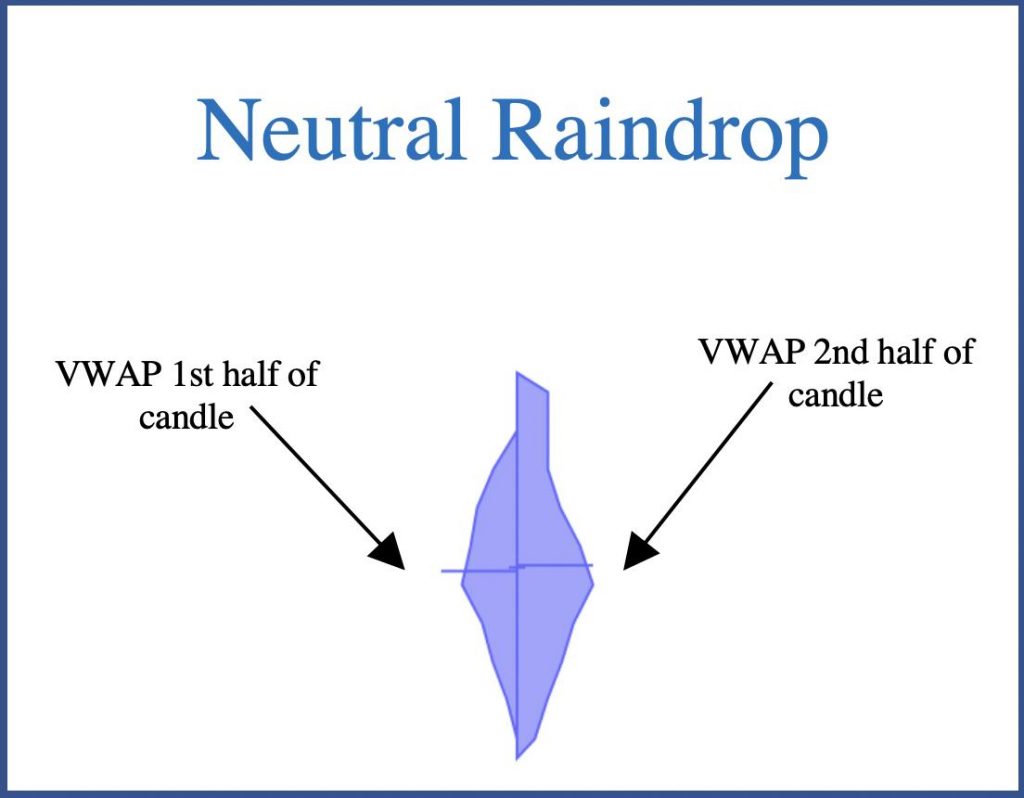
Unlike other charts, there is a particular special case worth noting in Raindrop Charts when the VWAP price of each side of the Raindrop happen to be equal (or approximately equal; see more below).
We call this type of Raindrop a Blue Doji Raindrop:
![]()
As I mentioned, we believe this Raindrop is very special.
Given that Left and Right mean (VWAP) prices are actually weighted by volume, this seems to be a “true” Doji — one which indicates that the vast majority of the volume was traded on the same price level across both halves of a Raindrop’s period.
This indicates a market consensus, but is it all that it can tell us?
In my research on the Blue Doji Raindrop, I’ve found a couple of interesting cases, some of which might inspire the direction of further research.
Support and Resistance
Blue Doji Raindrops tend to form around Support/Resistance zones.
In this chart, I’ve highlighted the price range of each Doji drop and extended it to the right. The result looks pretty interesting (SPY,30):

The impact of two or more Blue Dojis price levels become more apparent when they form on overlapping price levels (NFLX,30):

I can’t claim that this is a sufficient method for defining SR zones on its own, but it might be a good addition to another strategy.
I’ve also found that Blue Dojis with long body seem to be less impactful and illustrative.
Serious research should be undertaken in order to figure if this finding has any statistical significance.
Here’s a set of full-size samples: SPY,30 , NFLX,30, MCD,30, QQQ,30 .
Predicting Reversals
Dojis forming during falling trend might precede the reversal.
In my research, I have conducted some shallow backtesting to see what happens when a Blue Doji Raindrop forms during a falling trend.
I have defined the “falling trend” as the SMA (10) decreasing AND SMA (15) being below SMA(30)”. This definition might be imperfect, but it’s fine for the purpose of this basic exploratory research.

Here’s an example of a case like that (certainly, not all of them are this beautiful).

Backtest results: These formations seems to be rather rare, and we did not analyze enough data to ascertain the statistical significance of the charts below. More research is required.
The result for QQQ,30 was pretty encouraging, indicating (at least) short-term trend reversal. The chart below is based on 26 occurrences found through a year of data, which is a very small data set. The purple line shows Change% after X candles have passed since the triggering condition has formed. The blue area shows the variation range, from 25th to 75th percentiles.

MCD,30 (24 samples across a year of 30 min Raindrops)

SPY,30 (28 samples, a year worth of drops)

NFLX,30 (25 positions, a year worth of data) — this chart reveals no reversal

That’s it for now.
For more information on Raindrop Charts please visit the links below:
Comparison tool — see how Raindrops look side-by-side with Line Charts, Candles, Bars, Heiken Ashi, etc.
White paper — read the official white paper on Raindrop Charts to learn how they are constructed
Read the official press release
Sign up for a free trial of TrendSpider to try them yourself!
TrendSpider is a new type of charting platform designed to help active traders make smarter trading decisions by automating the grunt work they normally do by hand. It is the first (and only) charting system to offer a fully-customizable automation engine and patent-pending dynamic price alerts on indicators, trendlines and complex multi-conditional criteria on top of a charting system. Through these features and others, TrendSpider helps active traders find better trade setups, faster, with greater accuracy, while improving their trade timing. Here is the link to check this charting service out——> https://www.trendspider.com/
