Skip to content
 $SPY Chart 5/31/15
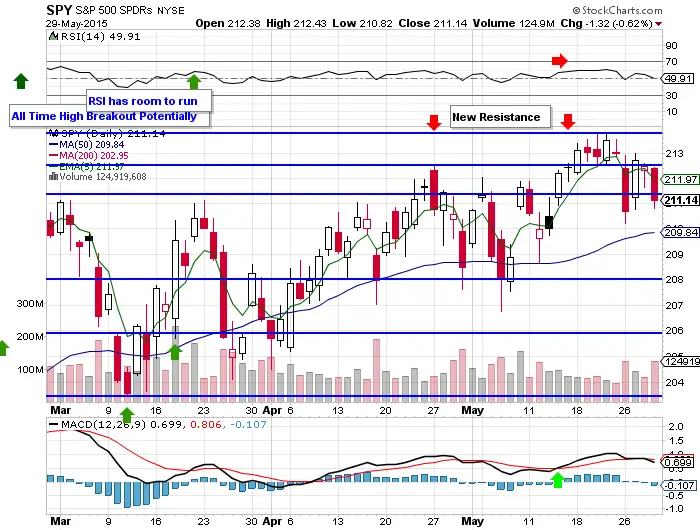
- $SPY ran into resistance Friday, May 22nd and reversed.
- $SPY spent all last week under, or being rejected at the key secondary resistance level of $212.70.
- Near term support is at $210.75, but it’s soft and has been penetrated easily.
- The next level of support is the 50 day SMA.
- The RSI at 49.91 shows little momentum, and is slightly bearish.
- MACD crossover Thursday is bearish.
- The market is currently range-bound. Buying weakness has been rewarded, while buying momentum has been punished with reversals.
- Last week, volume on down days was greater than volume on up days, showing distribution.
- So far this year, selling bearish credit spreads has been the best working system in the stock market.
- My buy spot for a dip in $SPY would be at the $208 support and under the 35 RSI.
