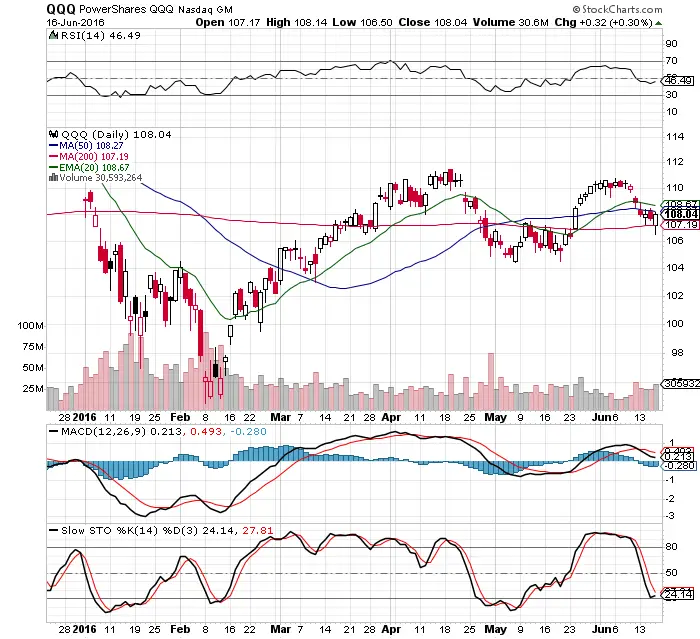
This could be a $QQQ reversal off a near term bottom in the short term based on the today’s price action. I entered $TQQQ today at $97.38 after the confirmed reversal through the 200 day SMA. I will let price be my guide whether I am stopped out with a close under the 200 day or letting my profits run higher.
Here are the five things I like to see for me to buy dips and then start trading the long side again.
Here are the 10 signals that show $QQQ could be reversing from the near term lows in price.
- First, the $QQQ has to reverse and go higher and reject the RSI in the 30s. Lows were rejected today.
- $QQQ retook the 200 day SMA triggering a long term buy signal.
- This rally off the lows happened on increased volume today. That is bullish.
- A big bullish candlestick today showed that bulls won in the short term.
- A rally back over the previous day’s high will show buyers at higher prices. I am still waiting for this.
- This reversal happened during the Brexit fears. That surprised a lot of people.
- $TLT reversed today from a very overbought 74 RSI with a candlestick reversal, this could prove bullish for stocks.
- $QQQ still needs to close over the 10 day EMA to show short term momentum.
- $QQQ still has to break and close over the 50 day as it is currently acting as resistance.
- A bullish MACD and Slow Stochastics cross over is still needed to confirm a reversal from the downward trend. Slow Stochastics appears to have bottomed out and to begin reversing.
Bulls won the day and stopped the falling prices in stocks but have a lot left to prove. Good risk/reward for the long side developing here on the long side.
