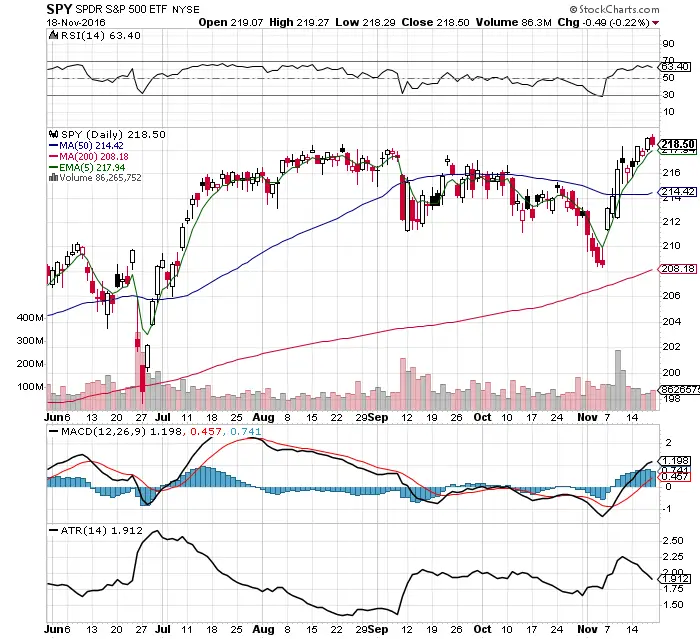
- $SPY price is above all key moving averages the 5 day ema, 10 day ema, 50 day sma, and the 200 day sma.
- $SPY is within striking distance of all time highs. Nothing is more bullish than all time highs.
- Financials are leading the market here. $XLF
- Bond prices are down and bond yields are up. $TLT
- The U.S. dollar is in a strong uptrend. $UUP
- RSI is high at 63.40 but has room to go higher. The 70 RSI has not held as resistance in other stock indexes. Strong bull markets do not have long term resistance.
- MACD is under a bullish crossover.
- The 5 day EMA is acting as short term support. This is support in the strongest uptrends.
- The ATR is declining. It is bullish to have decreasing volatility.
- Many traders and investors are trapped outside the market and waiting to buy any pullback which is providing support. Short sellers are forced to cover as each new high is broken adding fuel to higher prices.
I am currently long $TQQQ here and looking to buy any pullbacks in the stock market.