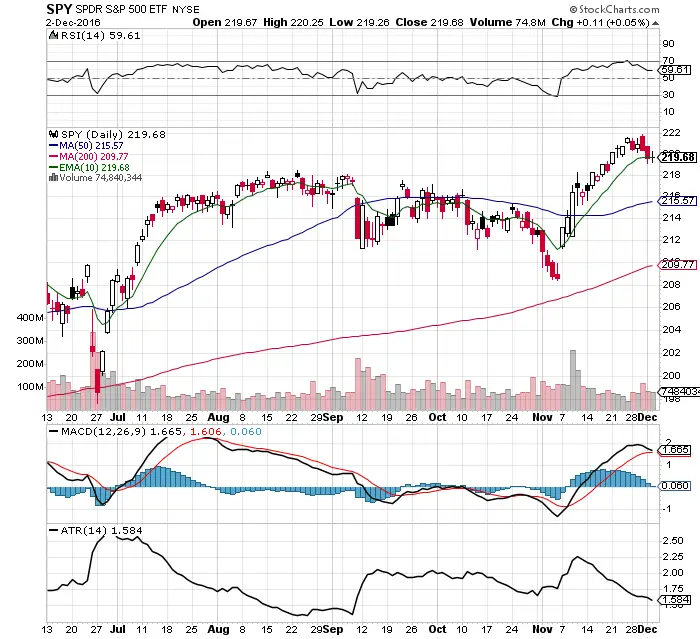
- $SPY is in a long term uptrend.
- Pushing against all time highs is the most bullish signal.
- $SPY has been range bound for the past seven trading days.
- The 10 day ema has acted as end of day support for the past 19 trading days. The 10 day ema is the first line of support.
- The $218.50 price level is the next line of support back to the near term breakout level.
- It is bullish that volatility has continued to fall. A volatility spike will be the first sign of a potential pullback.
- The MACD is close to a bearish cross showing a loss of momentum.
- An RSI of 59.61 is on the bullish side of the reading with room to go higher.
- The S&P 500 index leaders have been financials, energy, materials, and transports recently.
- Tech, consumer staples, and utilities have been the laggards in the S&P 500 index.
I am looking to buy dips in the indexes here.