Skip to content
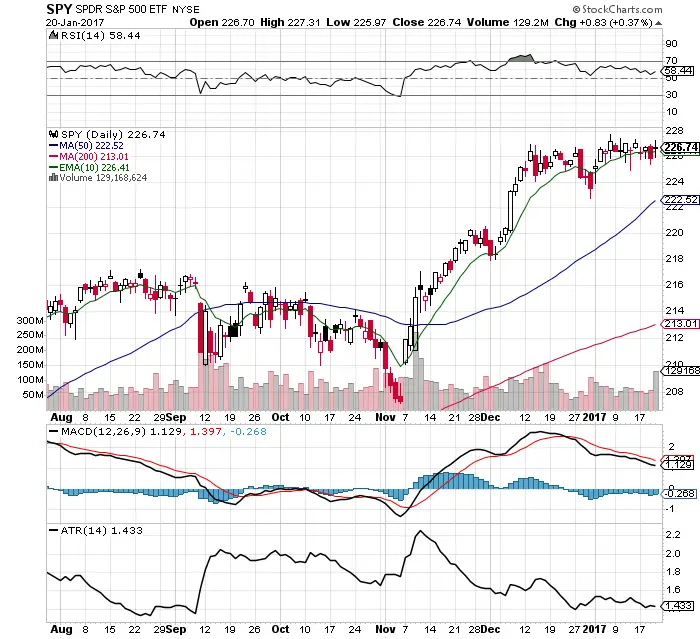
 Chart Courtesy of StockCharts.com
- $SPY remains in a long term uptrend but has made no progress to the upside since December 12th staying tightly in a range.
- Support is currently $225 while resistance is $228.
- RSI at 58.44 gives room for more upside in the short term.
- MACD remains under a bearish cross giving a warning of the trend failing to go higher.
- ATR has flattened out as volatility has failed to swing prices either higher or lower over multiple days.
- $VIX declined sharply after the inauguration to 11.54 as once again prices failed to breakout higher or lower.
- The 50 day and 200 day SMAs continue to be sharply ascending on the daily chart.
- The risk/reward does not favor entries this late in the uptrend as price is very extended from the metrics of P/E, EBITDA, and moving averages.
- For 5 weeks both holders of longs and shorts have failed to make money without active intra-day trading.
- This market is not currently under accumulation or distribution as it is simply being traded back and forth in a tight range.
