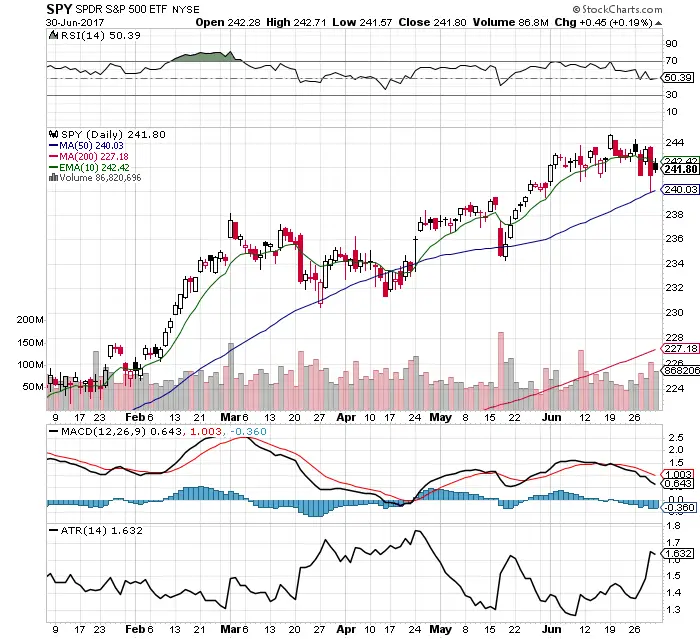
- The long term uptrend remains up with the 50 day SMA still not lost.
- Short term the market has gone sideways and momentum has slowed as price lost the 10 day EMA.
- Last week we saw resistance at all time highs of $244 and support at the 50 day SMA.
- Volatility has increased giving day traders more room to work intraday.
- The VIX increased to 11.18 but still a very quiet market as small dips continue to be bought.
- RSI is a neutral 50.39.
- MACD remains under a bearish Cross.
- Some rotation has been moving from tech to energy and financials.
- Last week volume was higher on down days than up days.
- This market is starting to move enough to be swing traded.
I am currently long $UWM and looking to buy deep dips.