Skip to content
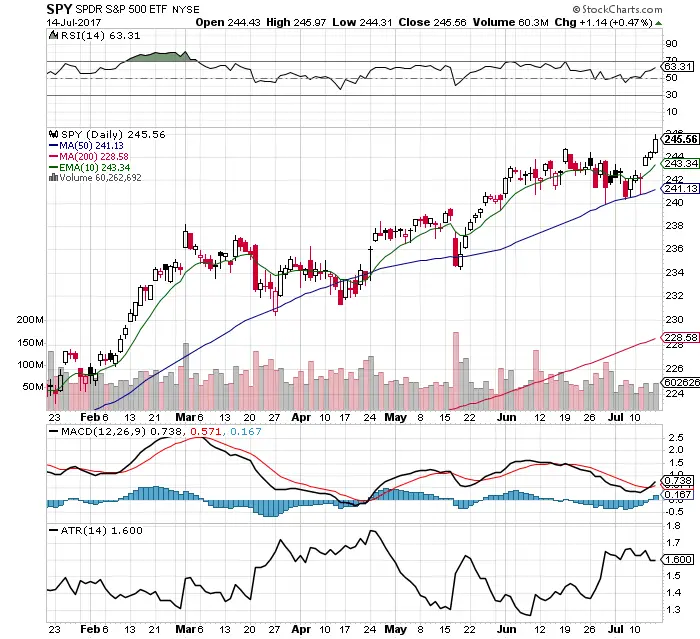
 Chart Courtesy of StockCharts.com
- The most bullish signal is all time highs. A these levels only profit taking provides resistance as stop losses and trailing stops are not triggered.
- $SPY remains in an up trend as price remains above all moving averages.
- The 50 day SMA held as support last week.
- SPY is under a bullish MACD cross over.
- The price range has increased over the past few weeks giving day traders and swing traders opportunities to trade on shorter time frames.
- Last weeks new high prices were made on low volume.
- VIX at 9.51 is near 10 year lows in volatility. This is very bullish and creates very cheap put options.
- There is still room for higher prices with RSI at 63.31.
- Leading sector ETFs are $XLB $XLK $XLF $XLI $IBB $SMH and $XLV. Lagging sector ETFs are $XLP $XLE $XRT and $XLU.
- This market has favored buy and hold investors in indexes and FANG stocks since the presidential election.

