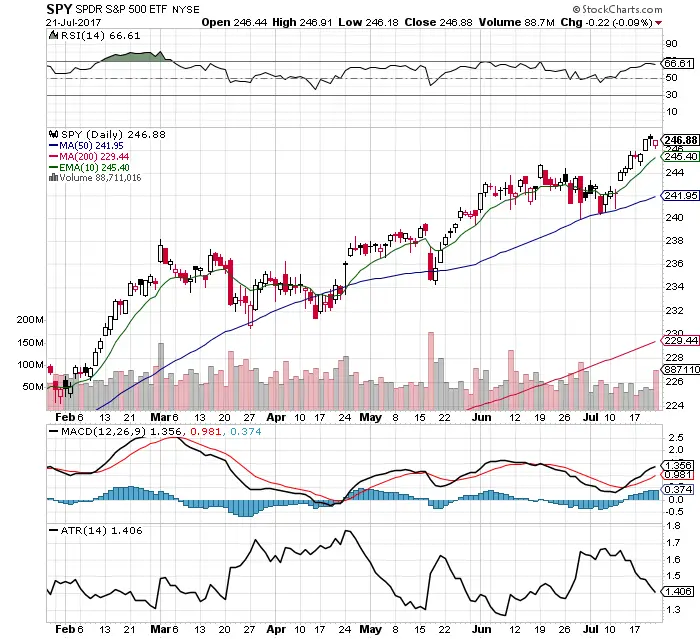
- $SPY remains in a strong up trend and pressing new all time highs in price.
- $SPY is above all moving averages.
- $SPY is under a bullish MACD crossover.
- The 66.61 RSI does not leave much room for upside without being overbought. Odds are next week will be a consolidation in $SPY as tech reports earnings. $QQQ may be the mover that tends to be able to become more overbought.
- The trading range declined last week as measured by the ATR. This is bullish.
- Fridays small dip was bought on high volume.
- $SPY went up last week on decreasing volume.
- VIX at 9.36 is near the lowest volatility reading in the past 10 years. This makes for very cheap put options.
- The best strategy here on $SPY remains to buy the dips not chase prices into overbought areas.
- Huge big cap earnings next week that will direct the next trend or pullback:
#Earnings Week $FB $AMZN $GOOGL $TWTR $CMG $X $PYPL $T $F $AKS $GILD $MCD $GM $BA $HAS $INTC $SBUX https://t.co/eDYHYwrKxe via @eWhispers pic.twitter.com/9Jld7Ijwfu
— Stephen Burns (@SJosephBurns) July 23, 2017
