Skip to content
 Chart Courtesy of StockCharts.com
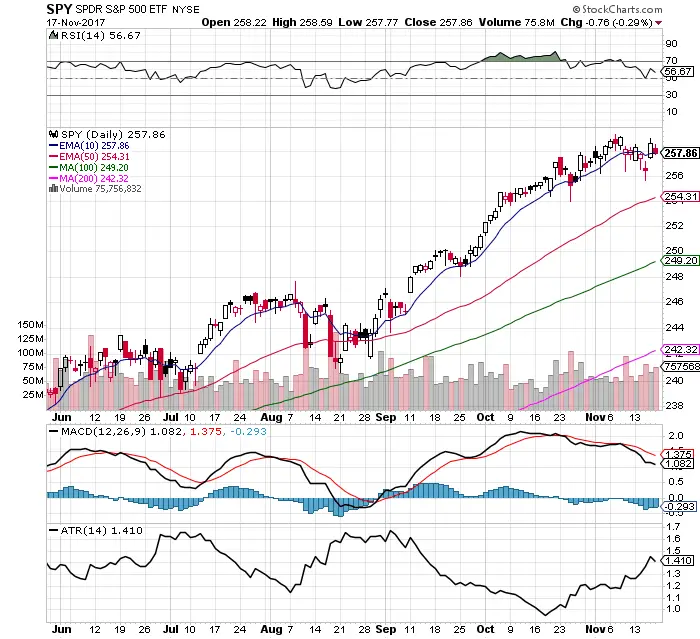
- Price remains near all times high.
- Price is above all key moving averages.
- $SPY is beginning to transition from an uptrend to a trading range with $255.63 as support and all time highs is resistance.
- The 10 day EMA failed to hold as end of day support last week as the market began to go sideways.
- RSI is at 56.67 and remains bullish.
- Down days had more volume than up days last week showing profit taking at higher prices.
- MACD remains under a bearish cross over.
- The trading range continues to expand as measured by the ATR.
- Volatility continued to expand and then contract ending at a 11.43 $VIX.
- These mixed signals are pointing to another week of trading inside a price range on a likely low volume holiday week.
