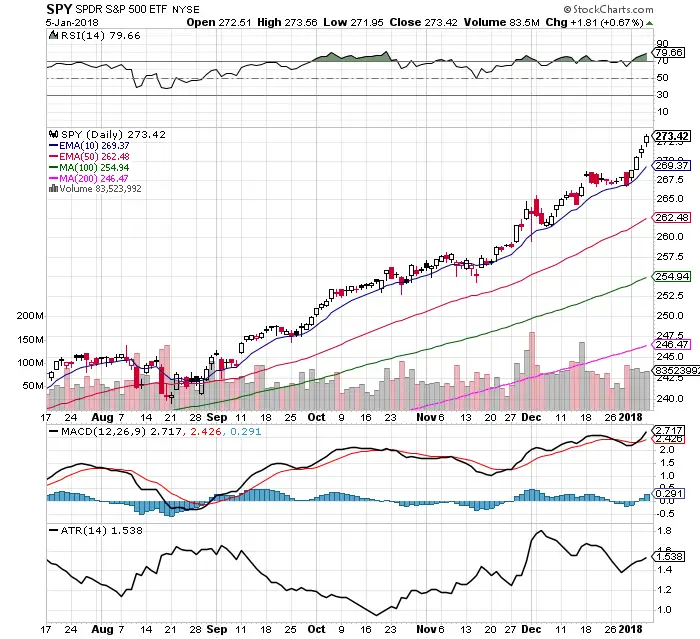
- $SPY continues to press higher to new all time highs. the most bullish signal as all people holding $SPY are sitting on a profit. No stop losses are trailing stops are hit at all time highs, the only selling pressure is profit taking while short sellers are pressured to buy to cover.
- The 10 day SMA has been the key end of day support for over 30 trading days.
- RSI remains overbought and parabolic at 79.66.
- The average trading range expanded to the upside last week after the breakout to all time highs.
- There was good volume on all four up days last week showing signs of accumulation.
- There was a fresh Bullish MACD crossover Wednesday.
- $VIX is back at an incredible low of 9.22 showing cheap put options on $SPY and little fear in the market of a pullback much less a crash.
- S&P 500 up 2.6% after 4 days in 2018, best start since 2006. Since ’50, 12 other times a year started >2.5% after 4 days. Full year higher 12 out of 12 with an average return of 18.6% and median return of 18.2%. (Via @RyanDetrick)
- Leading stocks like $FB $AMZN $NFLX & $GOOGL are back to new all time highs.
- Holding long positions continue to be the easiest way to make money in this relentless bull market.
My current positions remain long $IWM $IWC $ERX $BIB and $QLD
