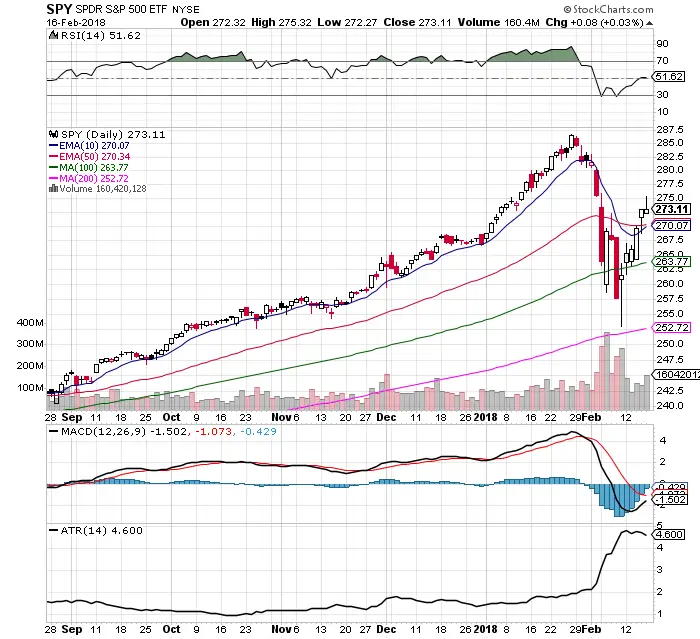
- The last two weeks has had very fast price action in both directions. Moves that use to take weeks now takes days.
- Last week was up on good volume comparative to normal daily volume.
- Last week $SPY recovered from one of the quickest corrections in history as price closed back over all key moving averages. The 100 day sma, 50 day ema, and 10 day ema were all retaken after bouncing near the 200 day sma the previous week.
- The chart is still under a bearish MACD cross under but is trying to reverse.
- The average true range stays escalated at 4.6 with the big move back to the upside.
- RSI is showing a swing to upside momentum at a reading of 51.62.
- In the past two weeks $VIX crashed from 50 back to 19.46 one of the biggest plunges in volatility since 2008.
- The last three days $SPY has made higher highs and higher lows .
- All sector ETFs reversed off lows last week. Appearing to be setting up the market for a swing higher.
- The 10 day ema / 50 day ema crossover is one signal I am looking at for additional long positions in $SPY and $SSO.
My current positions after buying the reversals from lows are $BIB $ERX $AAPL $QLD & $UTSL.