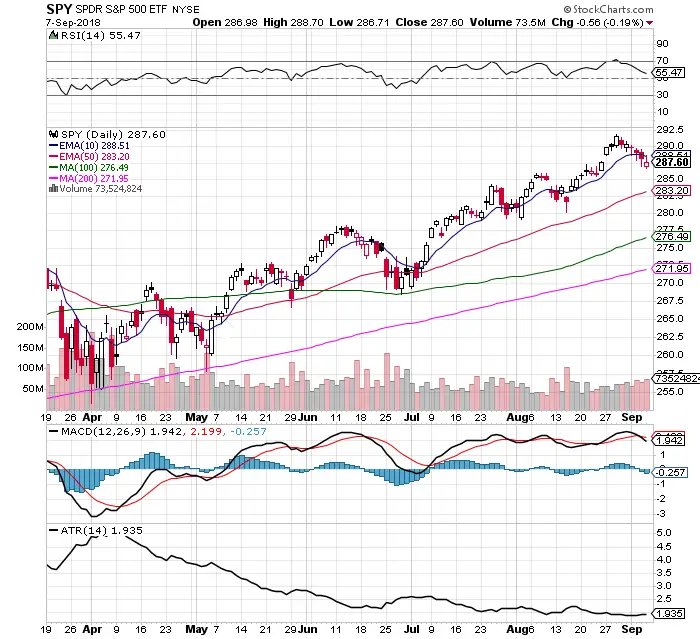
Chart Courtesy of StockCharts.com
- $SPY has now had an orderly six days straight of lower highs and lower lows. This is what a down swing looks like.
- Volume has been increasing during this swing lower in prices.
- Price closed under the 10 day EMA the last two trading days breaking the short term uptrend.
- The Overbought 70 RSI held as short term resistance on the up trend.
- The gap up in price from August 27th has been filled last week.
- The trading range continues to be tight with a 1.93 ATR that has not expanded yet.
- The $VIX closed above its 200 day moving average last week and the trend in the $VIX is up with higher highs and higher lows in price last week showing an expansion in fear of increasing volatility.
- The MACD had a bearish cross under last week.
- $SPY remains near all time highs in price.
- The next major support level is the 50 day SMA.
