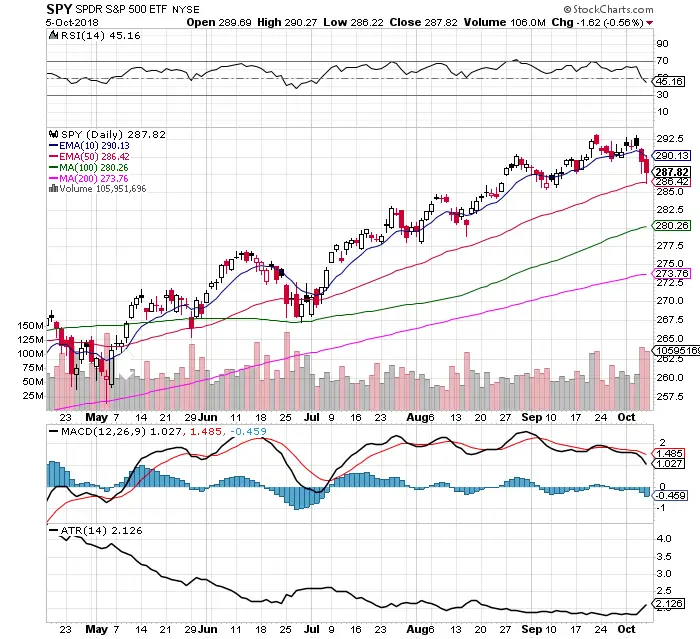
Chart Courtesy of StockCharts.com
- In October we saw the seasonal tendency for expanded volatility to the downside.
- A pullback to the 50 day SMA is a normal pullback in a strong bull market.
- VIX was held at 14.82 back under it’s 200 day moving average. The VIX expansion failed over the 200 day SMA twice last week.
- The Average True Range expanded to 2.12 last week the greatest increase of trading range since August.
- The MACD has been under a bearish cross under since September 26th.
- The drop on Thursday and Friday was on almost double the normal volume.
- The $SPY bounced at the 50 day SMA on Friday, this is the level that needs to hold for a normal pullback in an uptrend.
- $SPY currently closed at the 45 RSI on the bottom half of the RSI reading for the first time since early July.
- The 30 RSI is the next key level of support if the 50 day SMA does not hold. This 30 RSI dip could be a confluence that aligns closely with the 100 day SMA eventually.
- The most important question in this chart is “Where are the buyers waiting to step back in?”