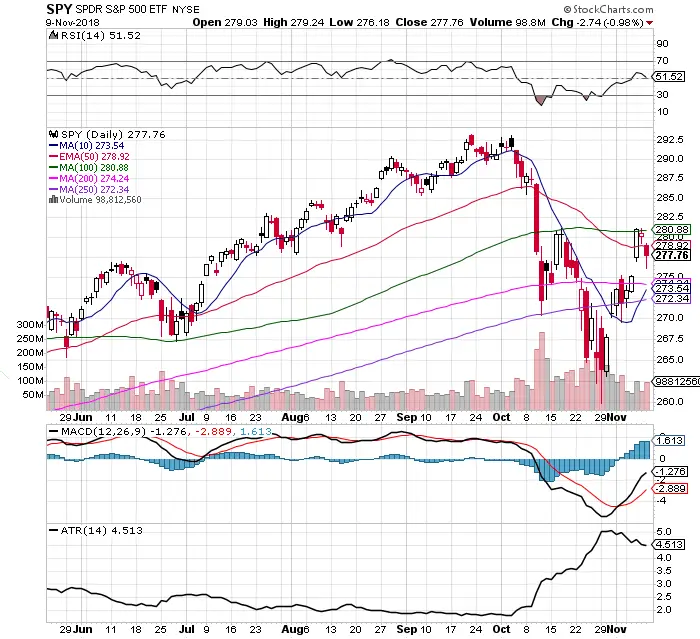
Chart Courtesy of StockCharts.com
- The Wednesday post election gap up low of day held for $SPY by the end of day Friday.
- $SPY found resistance on Wednesday and Thursday at the 100 day SMA.
- $SPY found resistance at the 50 day EMA on Friday.
- $SPY broke back over the 200 day and 250 day SMA in November.
- MACD remains under a bullish crossover.
- RSI remains on the strong side of the reading at 51.52.
- The $SPY trading range has declined in the month of November down to an ATR of 4.51 from higher levels.
- VIX bounced off the 200 day to 17.36 on Friday. Volatility broke it’s up trend Wednesday on the gap down that held.
- The unknown election outcome and contested elections appears to have triggered the sell off Friday. The rally could continue after the vote count is settled.
- Current chart resistance is at the 100 day SMA and short term support is at the gap of low on Wednesday.
- Bulls currently have the edge after the recent low was made. I am currently long $SSO here from before the post election gap up.
- The October monthly close was under the $SPY under 200 day SMA. This is a bearish backtested signal on the monthly timeframe.
The bulls are currently winning on the daily timeframe but the bears are winning on the monthly.