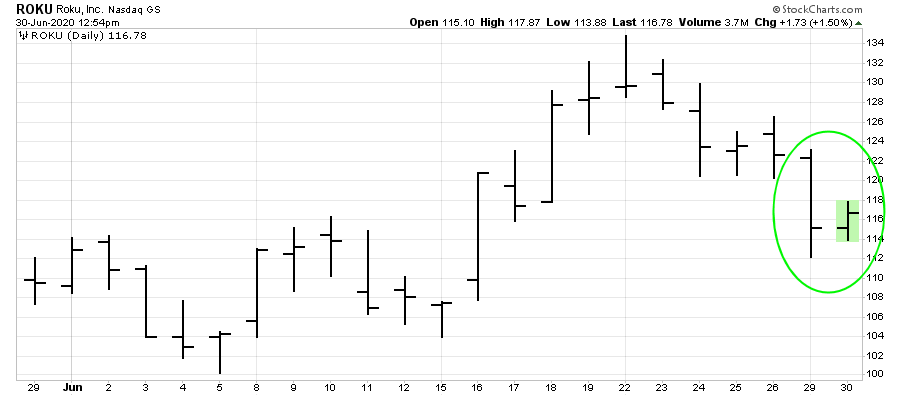
On a bar chart an inside bar is a single bar which is smaller than the previous one and within the range of the highest price and lowest price of the last price bar. An inside bar can be located in relation to anywhere inside the last bar, the top, the middle or at the bottom but can not at anytime during its trading period exceed the high or low of the previous range.
The highs or lows of the inside bar and the prior bar can be the same just not broken to the outside. If a price bar has the same highs or lows of the previous bar it can still be defined as an inside bar.
In technical analysis the bar prior and before the inside bar, is called the “mother bar”. An inside bar is called an “IB” and the mother bar is called an “MB”.
The inside bar was originally named for the bar charts that were used before candlestick charts were introduced in the west. It was literally and inside bar on a bar chart as seen below but the name has carried over to other types of charting like candlesticks.

Inside bars can be used to trade trends by going with the path of least resistance of the current direction of the trend. They are usually used for breakout plays as the price action breaks out in one direction from the inside candle. They are also used as indicators of a counter-trend reversal when the inside bar breaks back through key chart levels of resistance or support in the opposite direction of the prevalent trend, when this happens it is called an inside bar reversal.
The most common way traders use as an entry signal for an inside bar is to buy a break above or sell short a break below at the high or low of the previous mother bar. The stop loss is usually set at the other end of the mother bar to signal a failure to trend.
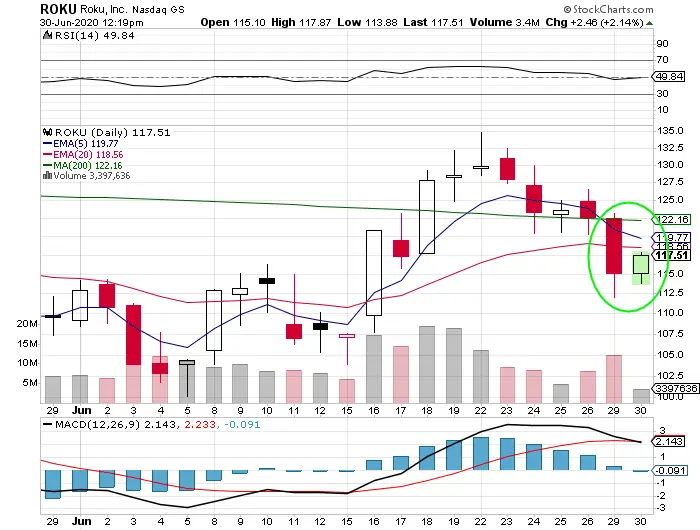
Below is an example of an inside bar on a candlestick chart.

Chart courtesy of StockCharts.com
Below are examples of bearish inside bar reversal patterns.


Source https://en.wikipedia.org/wiki/Candlestick_pattern
During a directional move on a chart an inside bar candle shows a pause in the current trend as it quits making new highs in price, which direction the next break happens in relation to the mother bar can be a signal for which way the market moves next.