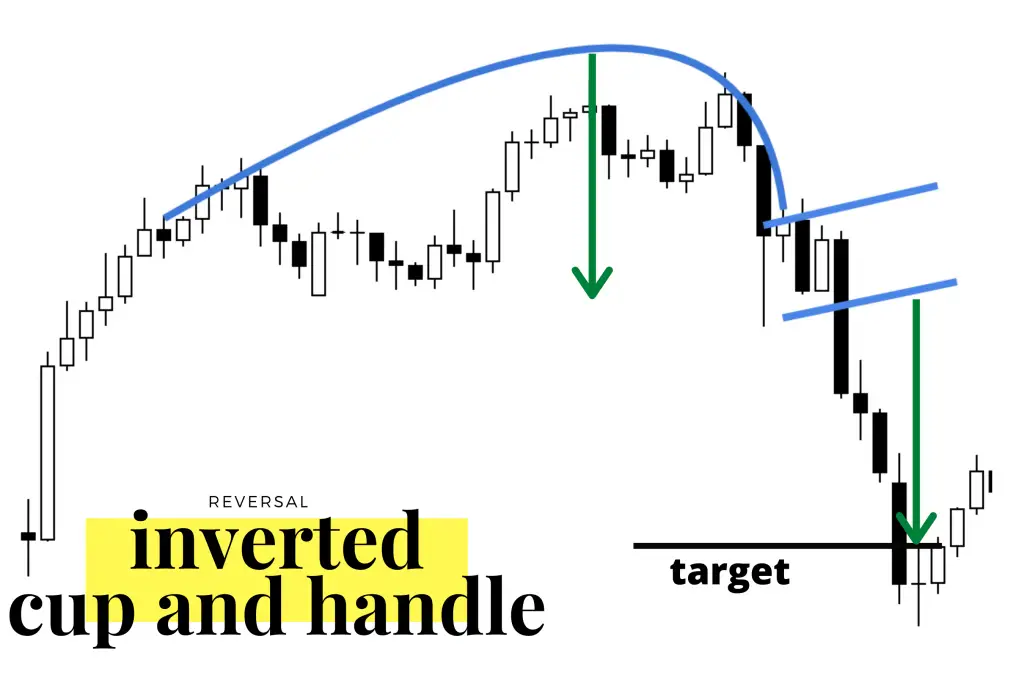
The inverted cup with handle is a reversal pattern and momentum sell short signal as it breaks down out of the ‘handle’ in the formation. It is usually a topping pattern after a strong move to the upside signaling the end of an uptrend on a chart.
An inverted cup and handle chart pattern ideally takes place at the end of bull markets when the stock indexes are near all time highs in price.
In order for the inverted cup and handle short setup to have the highest odds of succeeding, it should come after a clear uptrend was in place. The chart pattern consists of two key components: The rolling over price action nature of the inverted cup and the failed rally in the inverted handle.
The cup part of the formation is created when profit taking sets in on every attempt to make a new high in price and the market begins to slowly go into a distribution phase instead of rallying to new highs. The inverted cup top is formed when the stock finally runs out of buyers at new high prices and sellers start moving in and bidding the stock down.
Most of the time as the stock emerges out of the right side of the inverted cup and begins to fall it fails to break down and meets support the first time it tries to break out to new lows in price. This is when the pattern forms an inverted handle inside a trading range. The second run at new lows usually works as the majority of buyers have been worked through and the stock breaks down to new lows.
This pattern sets the stage for a big downtrend because the majority of short term traders bought as the stock fell out of the bottom of the inverted cup, the top was formed when the potential buyers of the stock on the sidelines refused to buy the highs of the resistance level at the top of the inverted cup, then new buyers were worked through as the market fell through the right side of the inverted cup.
Buyers at new resistance highs near the top were the last buyers of the chart as it failed to break out of the inverted cup pattern because of a lack of buyers at those prices.
The chart then swings down in price as stop losses and trailing stop signals are triggered for exits.
- Inverted cup and handle patterns are not good probability trades if the general market fails to go into a pullback or correction.
- The pattern has better odds of playing out as expected if it belongs to a lagging stock in the market with declining sales and earnings growth.
- The stock should have had a previous uptrend leading into this pattern.
- Look for a classic shape. If you have to argue your way mentally into believing the shape is an inverted cup, it’s not an inverted cup. The trend line needs to curve up and then down like an upside down cup.
- Look for an inverted ‘U’ shape and volume that dries up near the cup’s high. Volume that dries up at the top suggests funds lost interest in buying. And inverted U-shaped bases are more likely to work than inverted V-shapes.
- Inverted cup and handle patterns can happen on both daily and weekly charts.
- This pattern has a higher probability of success if the breakdown of the handle low or support of the bottom of the cup lip happens on higher volume than the 10-day average volume of trading.
- This pattern is trying to capture a short stock position as it breaks down out of its handle and starts a downtrend due to distribution from money managers.
- The buy point is a momentum short signal as the stock makes a new low outside the bottom of the inverted cup. The stop loss can be set on the top of the ascending trendline of the inverted handle.
- A price target to the downside could be between 20%-50% but they can go lower and of course they can also rise back in price into the inverted handle and fail. A trader has to follow how it plays out by letting winning trades run but cutting losing trades short.

Image by ColibriTrader.com
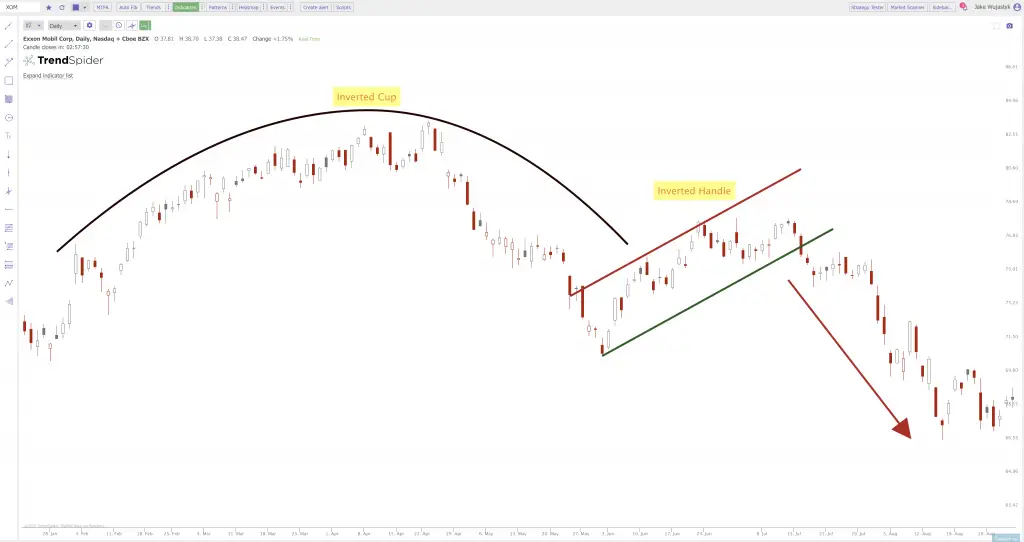
This Exxon Mobile chart below shows an inverted cup pattern from January through May as new highs failed to hold and price went lower after the peak. From June through mid-July an inverted handle formed inside the range of the inverted cup which looks like a vertical ascending price range channel. The breakdown of the lower vertical trend line support signaled a new swing down in price action from the middle of July through August.

For a deep look at all the most popular chart pattern you can check out my book The Ultimate Guide to Chart Patterns available on Amazon.