Here is a sample chapter from my newest book The Ultimate Guide to Candlestick Chart Patterns.
A candlestick is a type of chart used in trading as a visual representation of past and current price action in specified timeframes.
A candlestick consists of the ‘body’ with an upper or lower ‘wick’ or ‘shadow’.
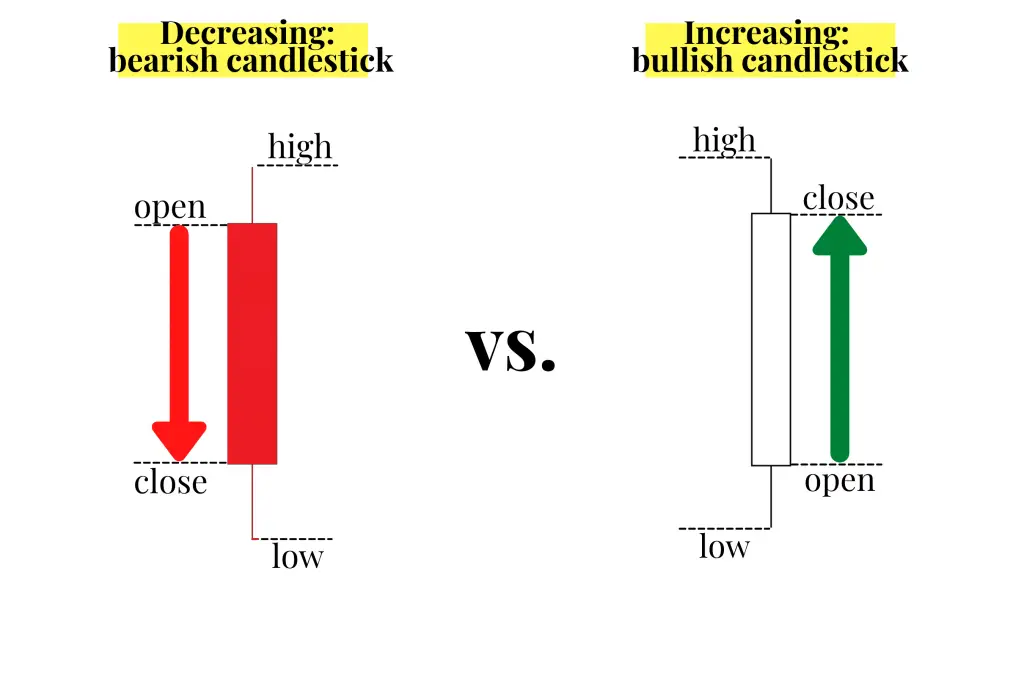
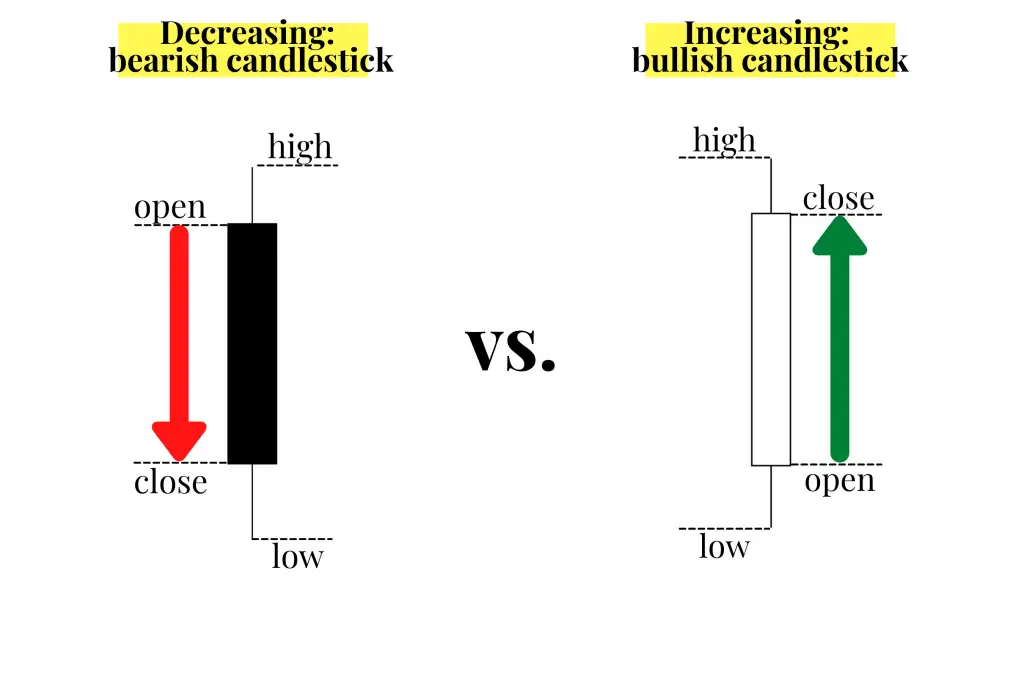
Most candlestick charts show a higher close than the open as represented by either a green or white candle with the opening price as the bottom of the candle and the closing price as the high of the candle. Also, most candlestick charts show a lower close than the open represented by either a red or black candle with the opening price as the top of the candle body and the closing price as the low of the candle body.
Price action that happens outside the opening and closing prices of the period are represented by the wicks or shadows above the body of each candle. Upper wicks represent price action that occured above the open and the closing prices and the lower wicks represent price action that occurred below the opening and closing prices.
Candlesticks are one type of chart that can be used in technical analysis to look for repeating patterns and in correlation with other technical indicators and signals.
Candlesticks are combined in many patterns to try to read the behavior of traders and investors in buying and selling to create good risk/reward setups for trading.
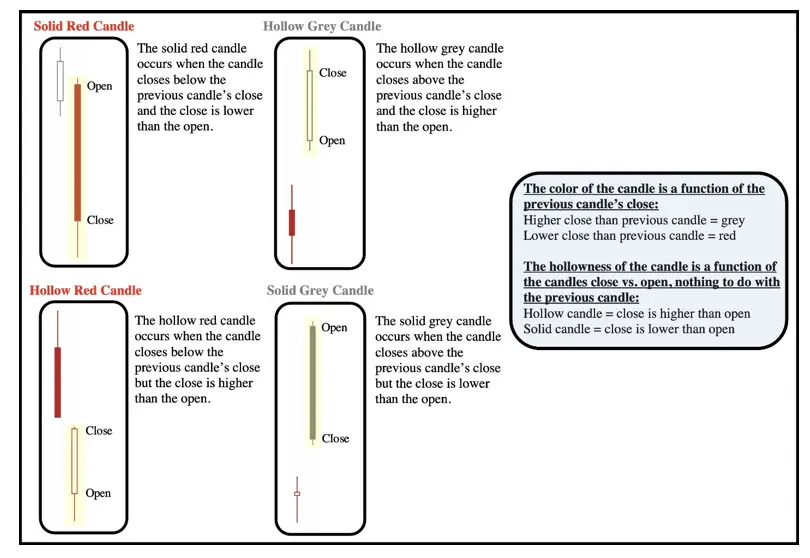
Candlestick charts have different settings. Candlesticks can be set to be green/red or they can be set as hollow candles. With the green/red settings the green candles occur when price closes higher than the previous close and red candles occur if price closes lower than the previous close.

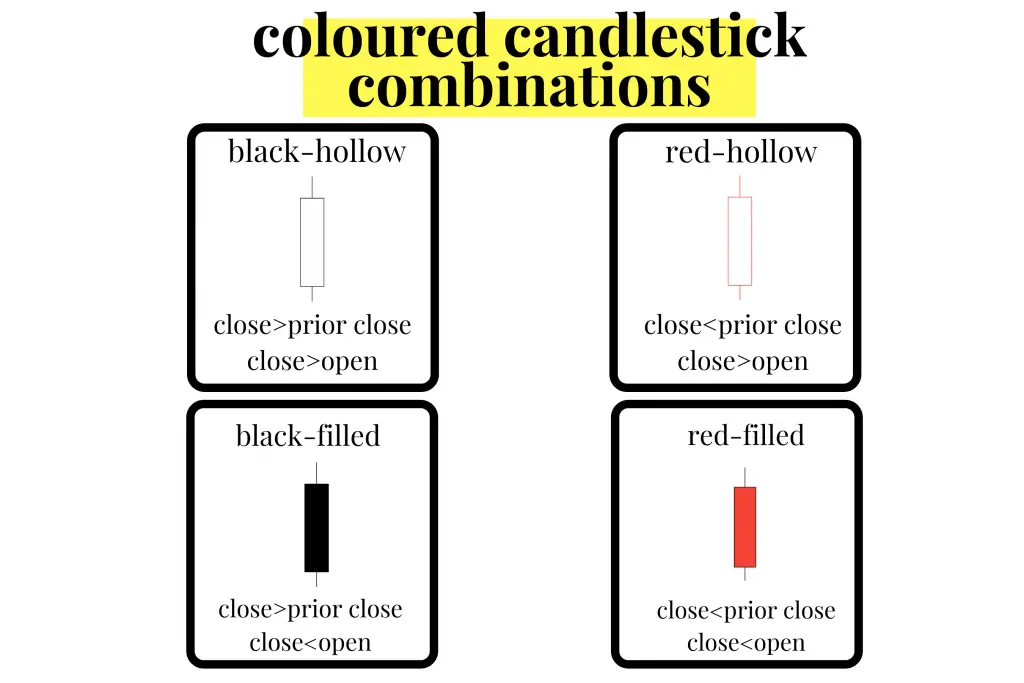
Hollow candlesticks are made up of four components in two groups. First, a close lower than the prior close gets a red candlestick and a higher close than the previous close gets a white candlestick. Second, a candlestick is hollow when the close is above the open and filled when the close is below the open. The following image shows the four possible hollow and filled candle combinations when using hollow candlestick chart settings.

Red-hollow candlesticks can show some bullish reversal price action on an overall bearish chart. Even as the closing price was lower than the previous close making the candle red the price action moved higher during the period after the open making it hollow. Even though it closed lower than the previous trading period, there was buying pressure near the lows that made it close higher than the open.
The solid black or grey-candle is the inverse price action of the red-hollow candle. Even though the closing price was above the previous close making it black, price action did finish lower than the open to make it a black-filled candle. Even though a black-filled candle closes higher on the current period versus the previous period, it does show selling pressure after the opening price. This candle shows rejection of intraday highs and can be a standalone signal of a bearish reversal during an upswing or uptrend in price action especially near new highs in price.
There are four types of hollow candlesticks:
- Hollow candles occur when the price closed higher than it opened.
- Filled candles occur when the price closed lower than it opened.
- White candles occur when the price closed higher than the prior close.
- Red candles occur when the price closed lower than the prior close.
Note that white candles have black or grey outlines and will at times also be called hollow black candles or hollow grey candles.

Learning to read candlesticks quickly is like learning a type of technical trading language. With time and experience a trader can see what candles are showing about the current price action. A trader can start seeing the patterns that emerge from buyers and sellers shifting the price action around key technical price levels of resistance and support on a chart. In this book you will see bullish, bearish, and neutral candlestick chart patterns and it is important to take the signals that they give in the context of the bigger picture of the chart.
Bearish candlestick patterns will have better odds of success when they occur on a chart and have confluence with other bearish signals like overbought readings or a loss of key price support or an important moving average. The same applies with bullish candlestick patterns having better odds of success when they occur on a chart and have confluence with other bullish signals like oversold readings or breaking above a key price support or resistance area or retaking an important moving average.
Candlestick chart patterns show you the present not the future. They can be used to position traders for good odds of capturing the next direction of price movement by aligning them in the path of least resistance. Profitable trading can emerge from going with the current trend on a chart along with letting your winning trades run and cutting your losing trades short. Along with doing all this with proper position sizing and discipline. Let’s begin our journey into more complex candlestick patterns.
For a deep dive into learning all the different candlestick patterns traders see on charts, you can also check out my book: The Ultimate Guide to Candlestick Chart Patterns
