This article is a sample chapter from my book The Ultimate Guide to Chart Patterns.
Chart Facts:
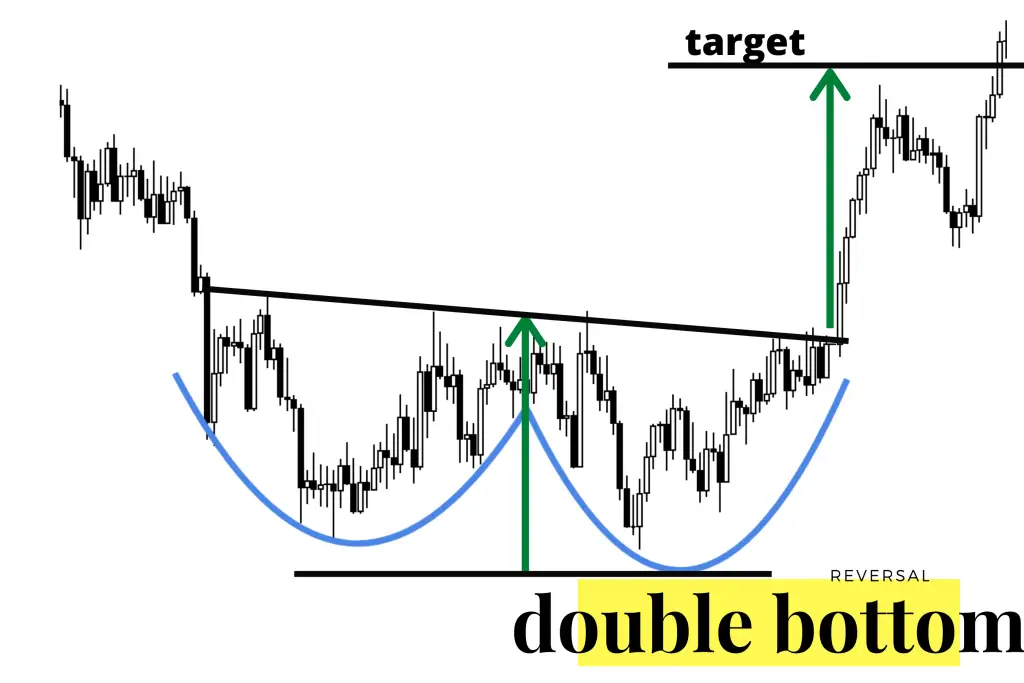
The Double Bottom Chart pattern is a reversal pattern that is bullish. This pattern is created when a key price support level on a chart is tested twice with a rally between the two support level tests.
- A double bottom chart pattern happens at the end of a downtrend that has likely gone on for weeks or months.
- The first bounce off support where price stops going down is the first support level.
- The first bounce and reversal in the downtrend is small and the short term run up is usually approximately 5% to 10% off the support lows.
- The first rally off the lows fails and price returns to the previous support.
- The previous price support lows hold on the second test.
- The second test of support must be confirmed by a reversal and trend, it is only a potential pattern until support holds and price rallies off the support with higher volume and sometimes a gap up in price.
- A breakout back over the high price that occurred in the middle between the double bottom support tests is a full confirmation of the double bottom reversal pattern. This is the level where a signal to enter long can be given.
- A double bottom chart pattern can take weeks and even months to play out with the middle rally resistance taking many different sizes and shapes.

Image courtesy of ColibriTrader
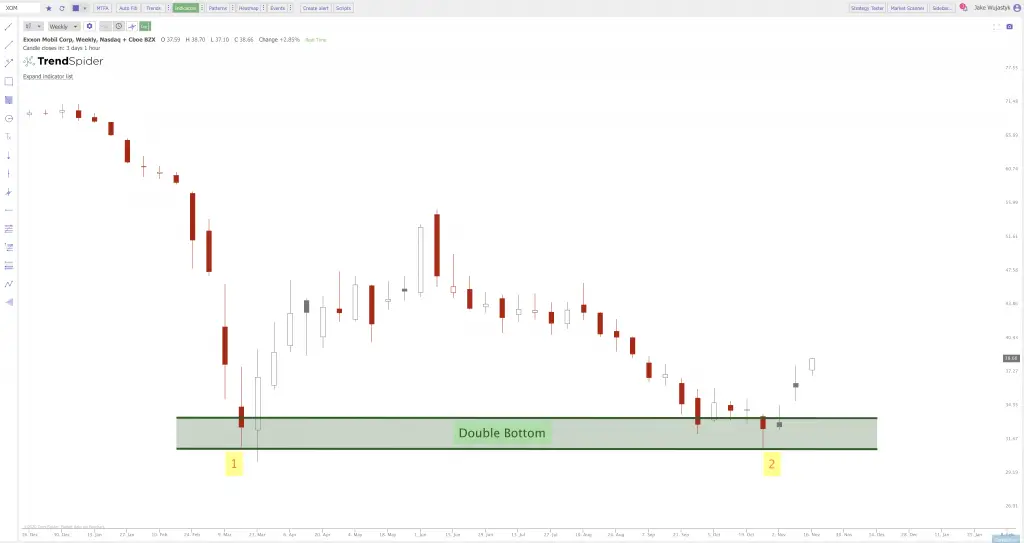
On the Exxon Mobil chart example, the double bottom support level is the horizontal support zone between $33 and $30. One potential buy signal that traders could have considered using for this chart was a bounce off the double bottom support near $29 and a break back out of the double bottom support zone around $33.

You can purchase my full book on Amazon The Ultimate Guide to Chart Patterns.