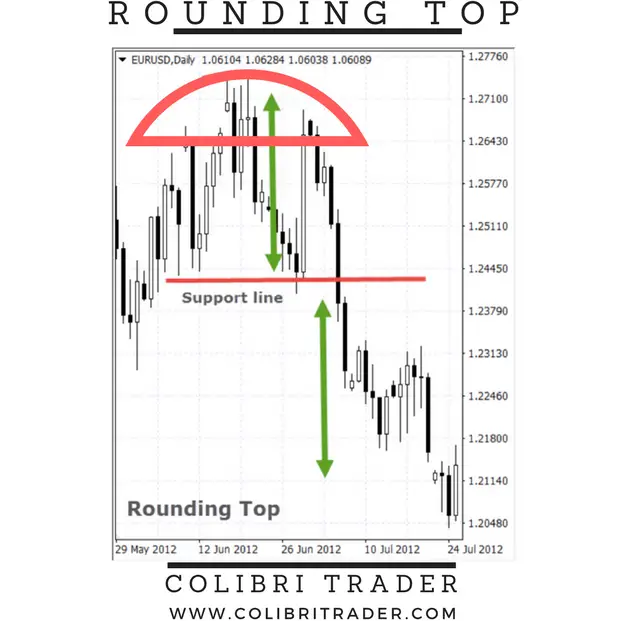
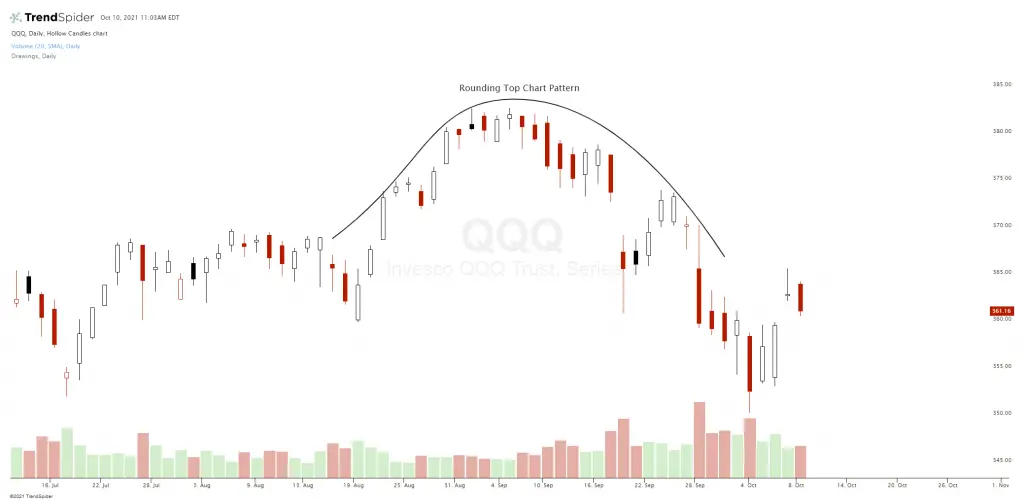
The rounding top is a bearish chart pattern in technical analysis. This pattern is formed when a chart puts in a top that forms when price curves up and then down in price. The right side of the curve will make higher highs on the left side of the move until the top price is in then curve lower to the downside making lower highs in price on the right side of the top.
The rounding top signals the potential end of a previous uptrend with the highest price is already in and shows that the odds are now for a down move in price action. This is a bearish reversal chart pattern when it occurs at the end of an uptrend near the price highs of the previous move.
The rounding top can form on any chart time frame and could take days, weeks, or even months to complete. The opposite of this pattern is the bullish rounding bottom which happens at the end of a downtrend on a chart.
Chart facts:
- The rounding top looks like an upside down letter U on a chart or an inverted cup.
- This can signal exiting a long position or selling short as it completes the rounding top.
- It signals a loss of new buying power as the old high is unable to be retaken and lower highs develop.
- This is a bearish signal on all time frames.

