This is a guest post by Jeremy Wagner, CEWA-M @JWagnerFXTrader on twitter, Certified Elliott Wave Analyst-Master. His website is seethewaves.com.
Getting Started with Elliott Wave Theory (Part 1)
Elliott Wave Theory was discovered by Ralph Nelson Elliott in the 1930s as a way to describe the market’s behavior. Elliott realized the markets trended in repeatable and recognizable patterns that can help forecast key turning points and the next trend.
Nearly every student to technical analysis has heard of the Elliott Wave Theory and is probably fascinated by the concept. However, despite its popularity, I see others using Elliott Wave incorrectly in forums, blogs and other media leading to a misunderstanding of its application. While traders are attracted to EWT due to the few simple rules, they find the real time application into the live market to be complex and prone to errors thereby stamping the theory as “too subjective.”
With some education and training, spotting market trends before they happen can be made easier with Elliott Wave Theory.
Elliott Wave Theory: The Basics
Developed by Ralph Nelson Elliott in the 1930s, Elliott Wave Theory was originally designed to forecast stock price movement. Overtime however, the theory has been applied to a variety of markets, particularly foreign exchange and crypto.
Elliott Wave Theory is now a very popular analytical strategy frequently used by the technicians of leading investment banks and intermarket players. The Elliott Wave Theory is founded on the notion that markets are not perfectly efficient. As a result, prices from one moment to the next are not random but rather subject to changes in overall investor behavior—changes that can be predictable with an understanding of mass psychology.
How to Count Waves
Before understanding the waves within Elliott Wave Theory, it is important to remember the tenet that every action creates an opposite reaction. Applying this thought to Elliott Wave, let us take a look at the most basic wave structure.

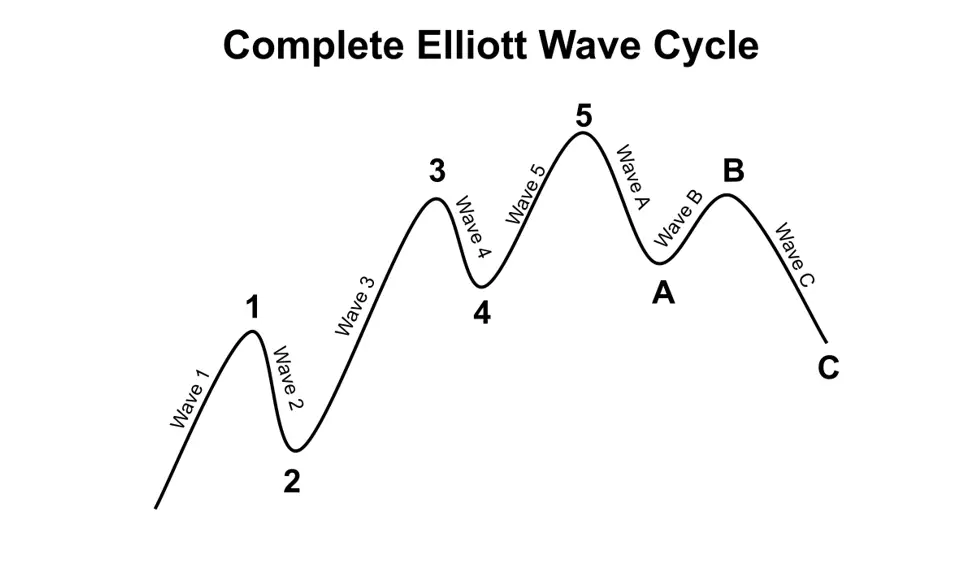
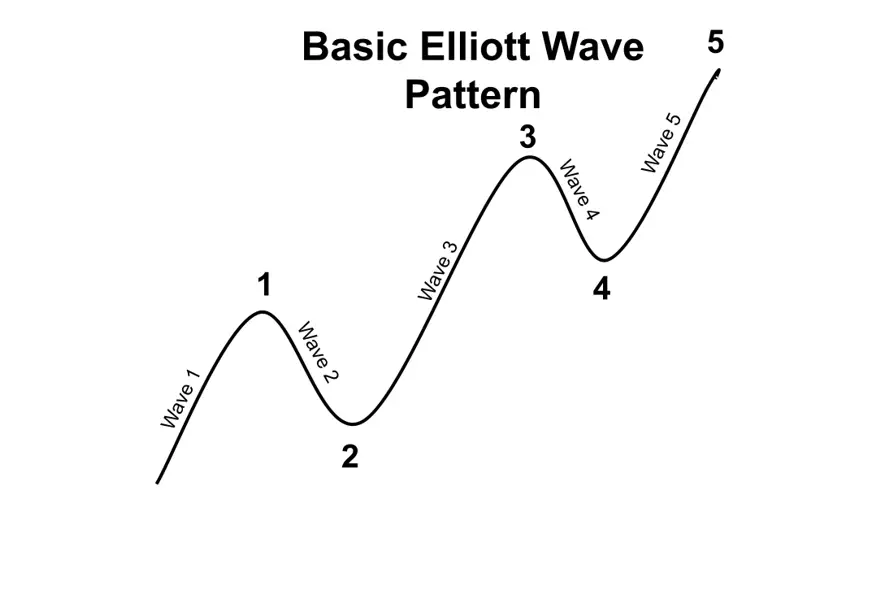
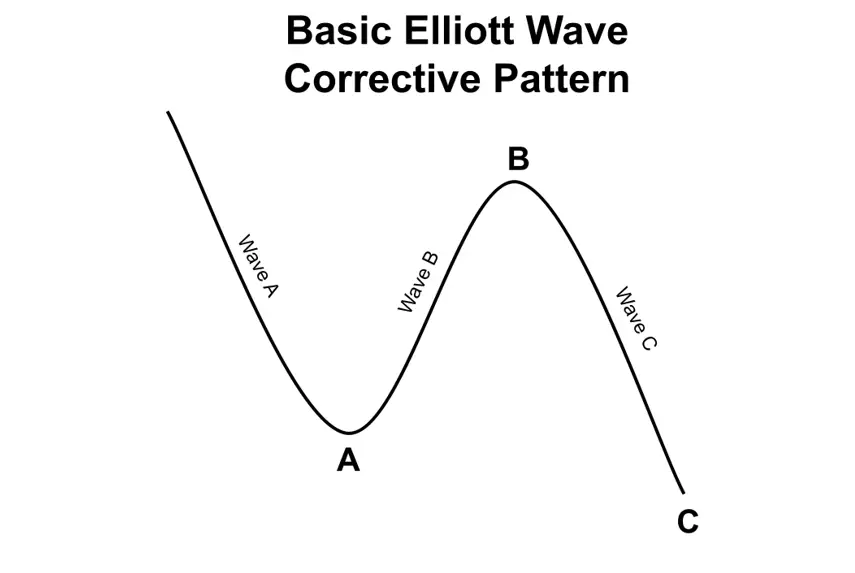
The center of the Elliott Wave Theory rests on the idea that security prices move in waves: motive (going in the direction of the underlying trend) and corrective (going against the underlying trend). As indicated in the diagram above, there are five waves defining the direction of the near-term trend followed by three corrective waves.
Motive and Corrective Waves
To fully understand the Elliot Wave Theory, it is important to understand the psychological rationale for each of these waves since the zigzag movement of prices represents the ebb and flow of investor optimism and pessimism.

Given in an up-trending market:
Elliott Wave 1 (Motive): Minor Up wave In Major Bull Move
In Wave 1, prices rise as a relatively small number of market participants buy the market for either fundamental or technical reasons, pushing prices higher.
Elliott Wave 2 (Corrective): Minor Down wave In Major Bull Move
After a significant run‐up, investors may get fundamental or technical signals indicating that the market is overbought. At such time, Wave 2 develops when original buyers decide to take profits while newcomers initiate short positions. Price action reverses, but generally does not retrace beyond its initial low that attracted buyers at Wave 1.
Elliott Wave 3 (Impulsive): Minor Up wave In Major Bull Move
Often the longest wave of the five, Wave 3 represents a sustained rally, as a larger number of investors use the Wave 2 dip as a buying opportunity. With a broader range of buyers, the security enjoys a stronger push higher, with prices extending beyond the top formed at Wave 1
Elliott Wave 4 (Corrective): Minor Down wave In Major Bull Move
By Wave 4, buyers begin to become exhausted and again take profits in reaction to overbought signals. Generally, there is still a fair amount of buyers, so the retracement here is relatively shallow.
Elliott Wave 5 (Motive): Minor Up wave In Major Bull Move
Wave 5 represents the final move up in the sequence. At this point, buyers as a whole are motivated more by greed than any fundamental justifications to buy, and bid prices higher irrationally. Prices make a high for the move before a correction or reversal begins. The high in Wave 5 often coincides with a divergence in the relative strength index (RSI).
Elliott Wave A-B-C Corrective Waves
Corrective waves are an interruption to the main trend. These waves are meant to fool traders into thinking the old trend is alive when in reality a trend change is forming.

Elliott Wave A: Correction To Rally
Initially Wave A may appear to be a correction to the normal rally. However, if it breaks down into five sub waves, it indicates that a new market trend may have developed.
Elliott Wave B: Bear Market Correction
Wave B tends to give bears an opportunity to sell as others take profit on their short trades or exit their long positions.
Elliott Wave C: Confirms End of Rally
Wave C is the last wave of the cycle. At this point, Wave C typically breaks key support zones and most technical studies confirm that the rally has ended.
Elliott Wave Count Rules
While determining waves in real time can be challenging, there are three rules to counting waves that always hold. These rules form the basic tenets of Elliott Wave Theory.
Rule 1: Wave 2 cannot retrace more than 100% of Wave 1
Rule 2: Of waves 1, 3, and 5, wave 3 can never be the shortest wave (it is, often the longest)
Rule 3: In an impulse, wave 4 cannot overlap wave 1
Elliott’s Rules vs Guidelines
Though the list of rules is concise, there is a much larger list of guidelines for Elliott Wave Theory. Rules cannot be broken. If you find a violation of a rule, that means your interpretation of the market is incorrect and look for another wave count where all of the rules are satisfied.
Guidelines are different. Guidelines have a tendency to appear, but they may be violated. Though guidelines do not have to be followed, finding them in patterns typically leads to higher probability wave counts.
Here is a short-list of some Elliott Wave Theory Guidelines:
In an impulse:
- Wave 2 typically retraces 38-78% of wave 1
- Wave 3 tends to have Fibonacci proportion to the length of wave 1 (1.618, 2.618, 4.23)
- Wave 4 typically retraces 38% the length of wave 3
- Wave 5 can become 38% or 61% then length of waves 1 through 3
Corrective waves:
- Alternating waves tend to have equality or Fibonacci relationships to their distances (i.e. wave C = wave A, or wave C = .618 x wave A)
- In a complex correction, the distance of wave Y tends to have an equality or Fibonacci relationship to the distance of wave W
- Corrections to a completed impulse wave tend to retrace back to the previous 4th wave of that impulse
In Conclusion
When a trader understands the reasoning behind each wave, then spotting the current pattern becomes easier. See Elliott wave in action by reviewing our Elliott Wave blog.
In part 2 of this series, we will inspect more closely the five basic Elliott wave patterns and their idealized shapes.
