
Most people think financial freedom requires a big salary or a lucky stock pick. It doesn’t. The whole thing runs on a few equations you probably learned how to do in high school algebra and forgot about by graduation.
Financial freedom simply means your passive income covers your living expenses. That income usually comes from an investment portfolio or a cash-flowing business, so reaching it depends on four pieces of math working together.
1. The Savings Rate Equation
Savings Rate = Amount Saved ÷ Take-Home Pay
The number that sets your timeline is your savings rate. That’s the share of your take-home pay you keep and invest, and it matters far more than the size of your paycheck.
Raising your savings rate does two jobs at once. You have more money going into investments each month, and you get used to living on less, which means your portfolio has a smaller lifestyle to pay for later.
Every dollar you don’t spend gets counted twice. It goes to work in the market today, and it’s also a dollar your future portfolio never has to replace.
The blogger Mr. Money Mustache published a widely shared calculation that shows the effect. Starting from zero, with a 5% return after inflation and a 4% withdrawal rate, someone saving 10% of their income needs about 51 years to reach financial freedom.
Push that savings rate to 25%, and the wait drops to about 32 years. At 50%, it’s roughly 17 years. A 70% saver gets there in around 8.5 years.
Income never shows up in that math. Saving half your pay gets you there about three times as fast as saving 10%, and that holds whether you earn $50,000 or $500,000.
2. Compound Interest and Exponential Growth
A = P(1 + r)^t
Portfolio growth follows the compound growth formula, A = P(1 + r)^t. Here, A is the ending value, P is the money you put in, r is the annual return, and t is the number of years.
Look at where it sits. It’s in the exponent, so time has much more pull on the final number than the amount you start with does.
That’s the case for starting early, even with small amounts. A person who invests modestly for 40 years can finish ahead of someone who invests much larger sums for 15 years, because each year’s growth is compounded over the years that follow.
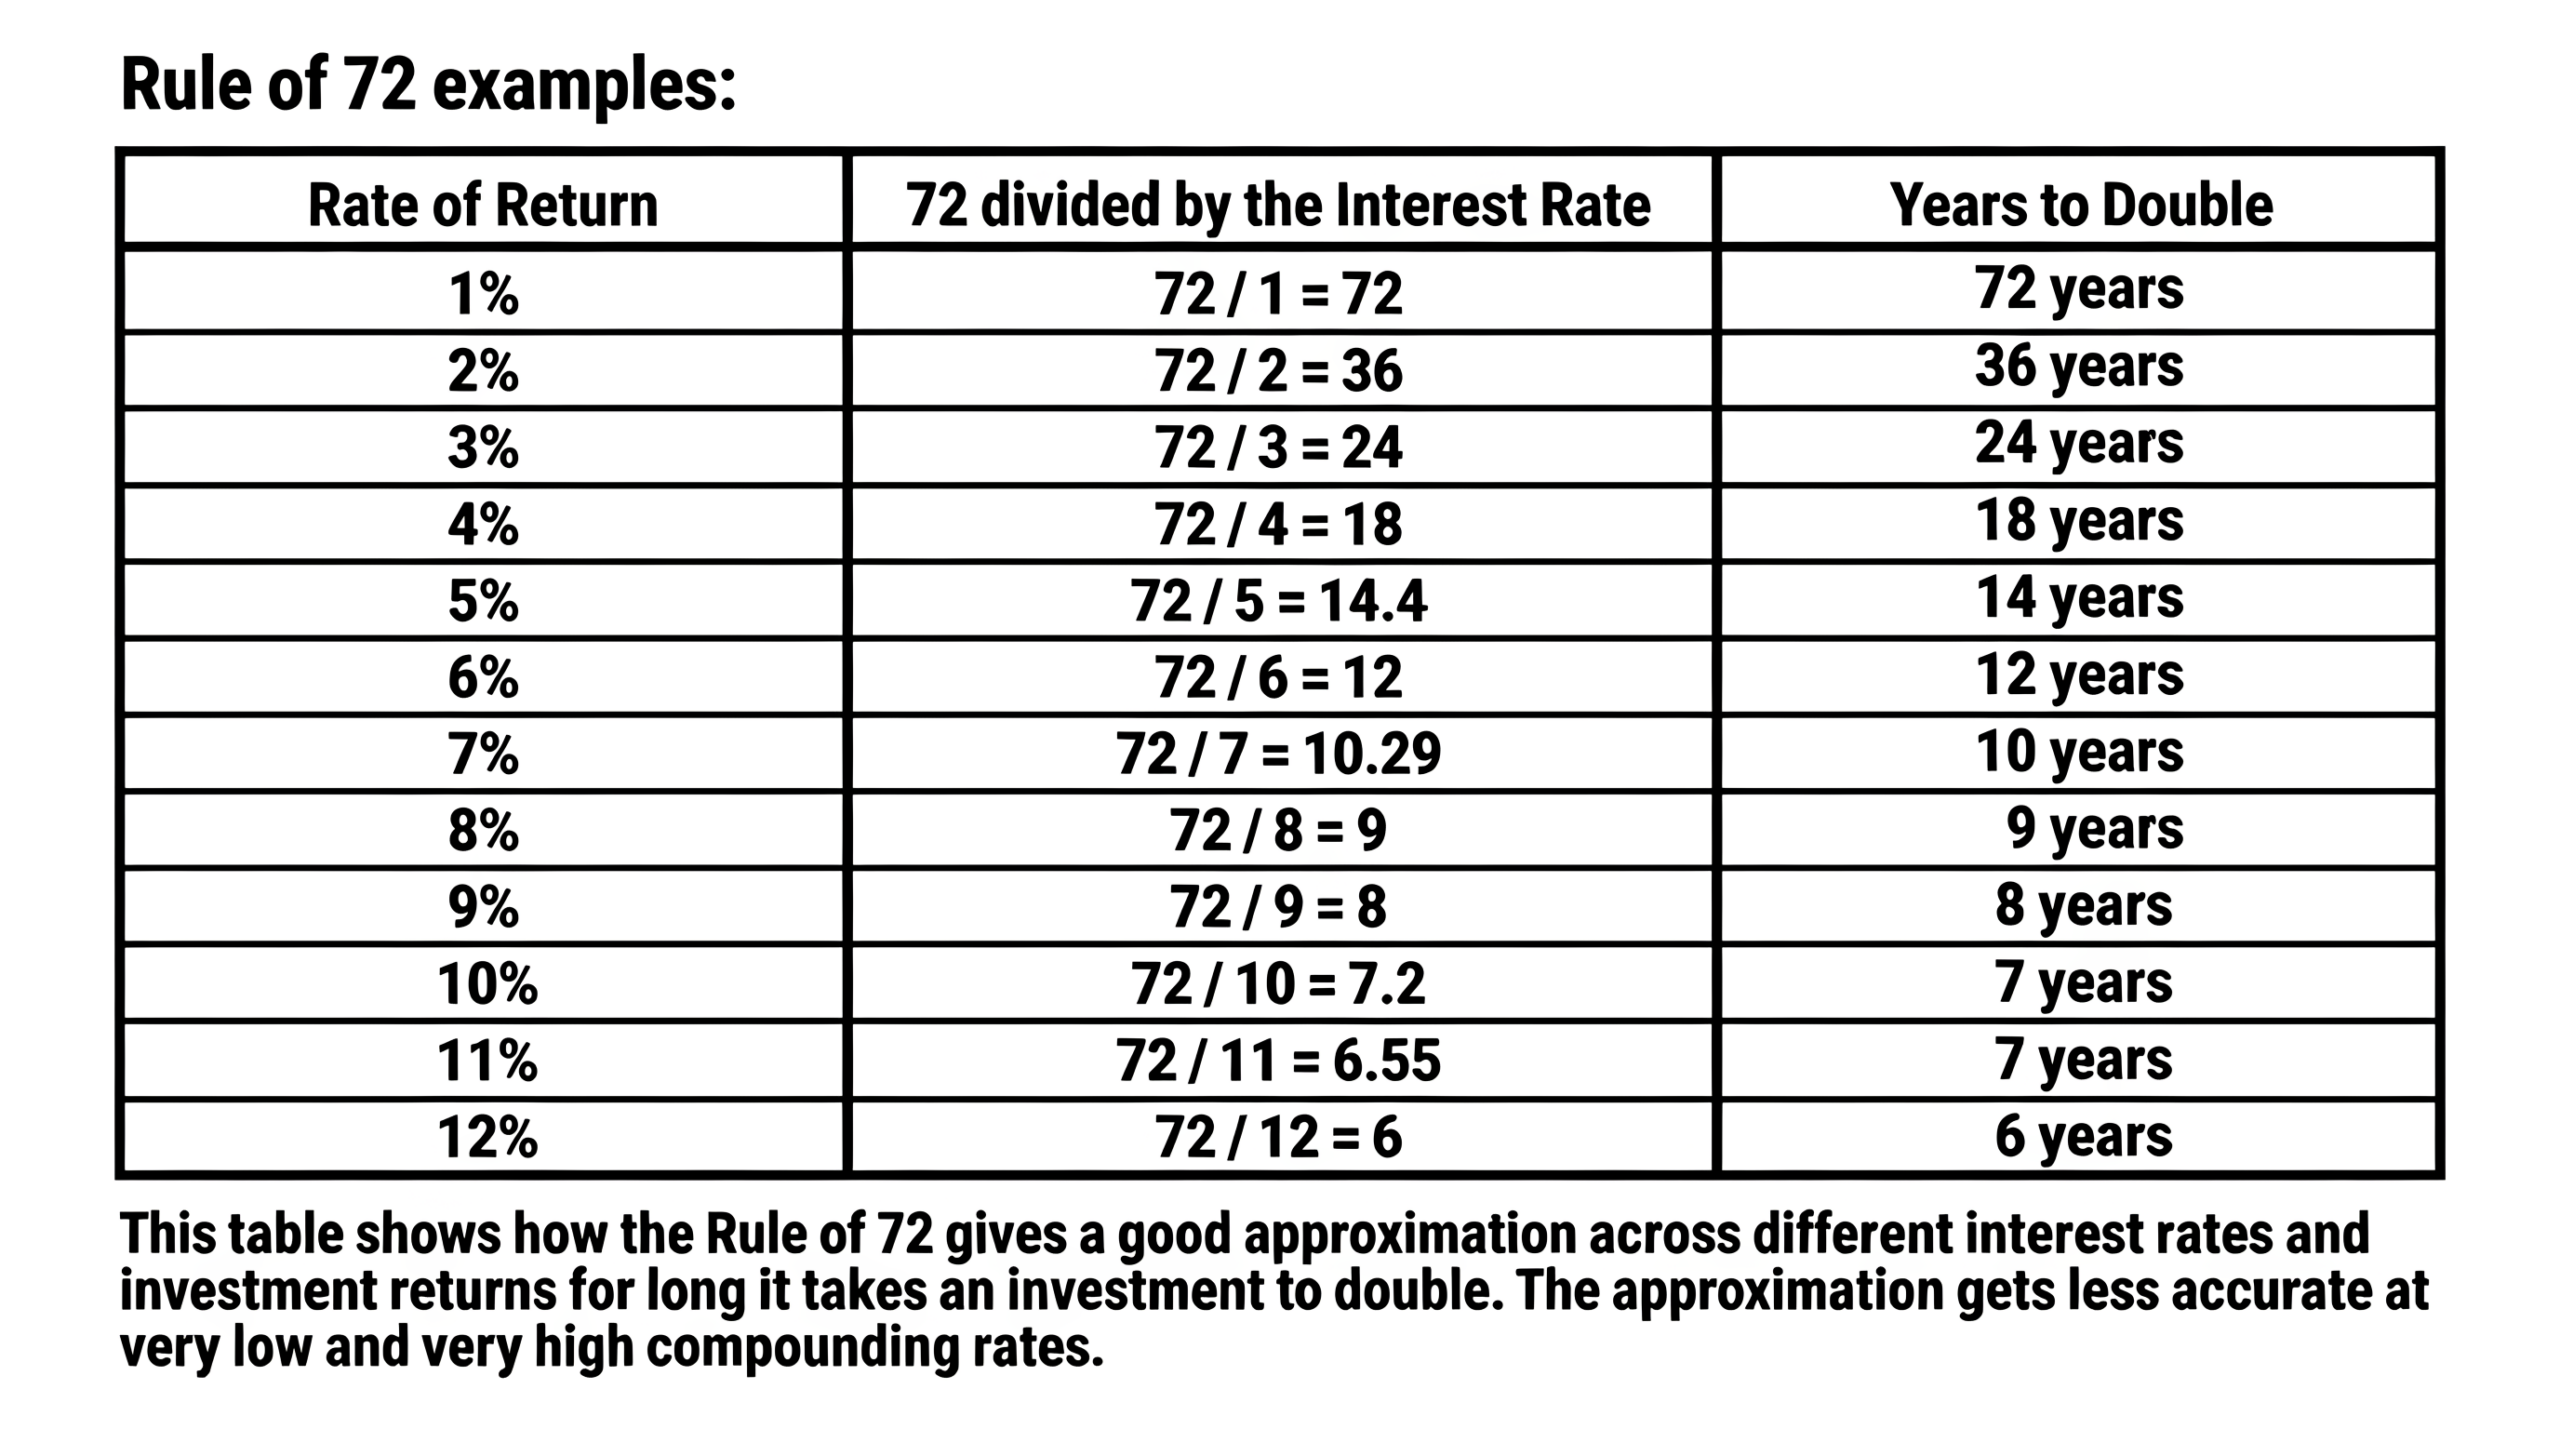
The Rule of 72 gives you a fast way to see this. Divide 72 by your annual return to get a close estimate of how many years it will take for your money to double. At a 7% return after inflation, that’s roughly 10 years per doubling. A dollar invested at age 25 could grow about fourfold by age 65.
3. The 4% Rule and Your FI Number
FI Number = Annual Living Expenses × 25
You need a finish line. Most people call it their FI number, the portfolio size that can support their life without running dry.
The usual way to find it is the 4% rule. Financial planner William Bengen introduced the idea in 1994, and three professors at Trinity University later tested similar withdrawal rates against historical market returns in what became known as the Trinity Study.
The calculation takes about five seconds. Multiply your annual living expenses by 25, because 25 is the inverse of a 4% withdrawal rate.
Say you need $60,000 a year. Your FI number is $1.5 million, and once your portfolio reaches it, you can withdraw $60,000 in the first year and increase that amount with inflation each year thereafter.
In the historical data the researchers studied, that approach persisted throughout most of the 30-year retirement periods. There’s no promise attached to it. Still, a number grounded in decades of market history beats a vague hope about “someday.”
This rule also shows why spending cuts hit so hard. Every $1,000 you trim from your yearly expenses lowers your FI number by $25,000. Dropping a $150 monthly habit, which comes to $1,800 a year, takes $45,000 off the target.
4. The Gap Between Income and Expenses
Gap = Income – Expenses
How fast you move depends on one subtraction problem. Take your income, subtract your expenses, and whatever’s left is your gap. You can widen it from either end. The two ends behave differently, though. Cutting expenses pays off right away. The money you free up can be invested this month, and your FI number drops permanently at the same time.
Raising income has no ceiling. You can only cut spending so far before you’re eating rice and beans in the dark, but there’s no hard cap on what you can earn, and bigger dollar amounts feed the compounding formula faster.
The strongest results come from doing both. If your lifestyle stays flat while your pay climbs, nearly every raise lands in the gap instead of on a car payment.
5. Putting the Four Equations Together
Passive Income ≥ Living Expenses
These pieces feed each other. Your savings rate sets the size of the gap; the gap decides how much money goes into compounding, and the 4% rule tells you when you can stop.
Take a household spending $40,000 a year. Its FI number is $1 million, and each bump in its savings rate both speeds up contributions and shrinks the spending its portfolio will eventually have to cover.
Two people saving 20% of their pay are on the same schedule even if one earns $70,000 and the other earns $140,000. The bigger earner puts away twice the dollars but also has twice the lifestyle to fund. Market returns are out of your hands in any given year. Your spending and your savings aren’t.
Some years, the market will drop, and your balance will shrink. The formula only works if it keeps running, and selling in a panic after a bad year turns a paper loss into a real one.
Conclusion
Treating financial freedom as a math problem takes a lot of the anxiety out of money decisions. You have a specific target, and your savings rate tells you how long it will take to hit it. Start with two numbers. Add up what you spent over the last 12 months, then multiply that total by 25 to get your FI number.
Then figure out your current savings rate and look for ways to raise it by a few percentage points this year. Run the formula again afterward and check how many years were removed from the timeline.