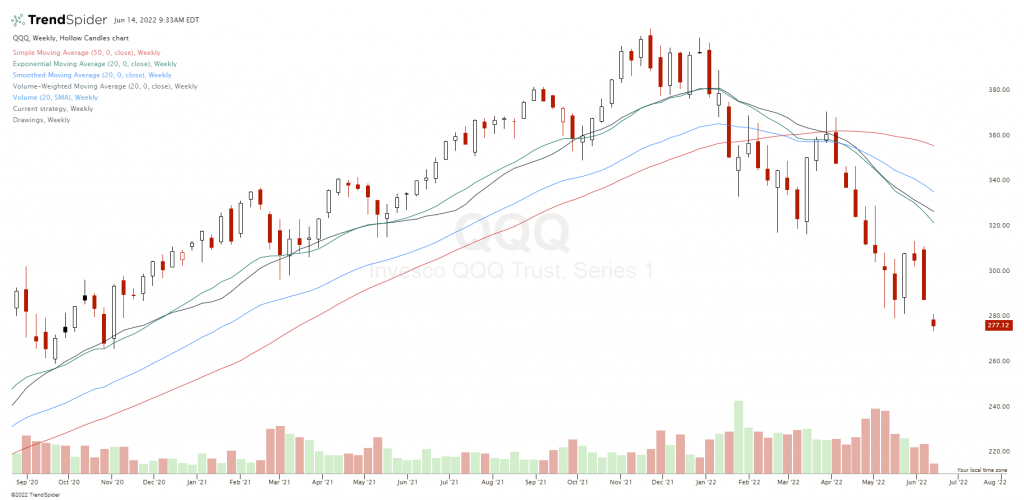
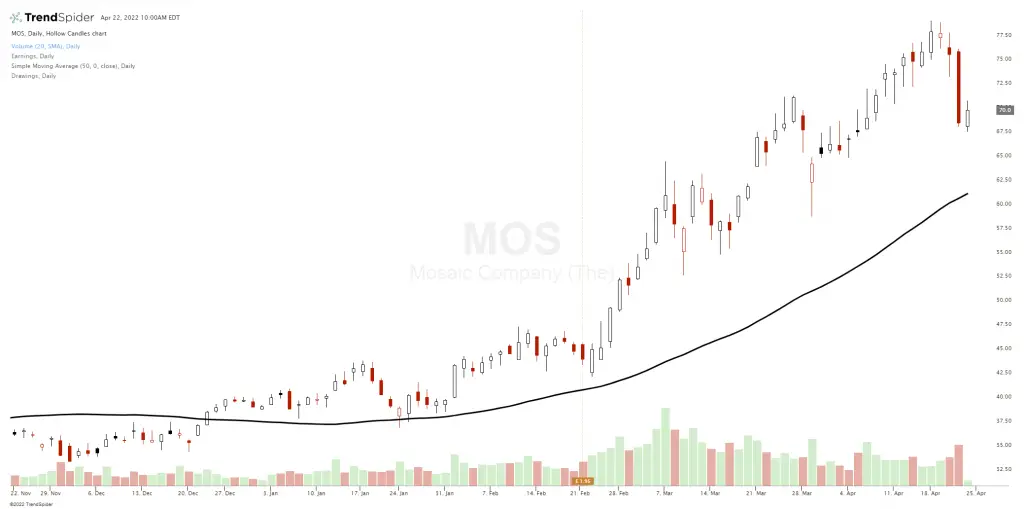
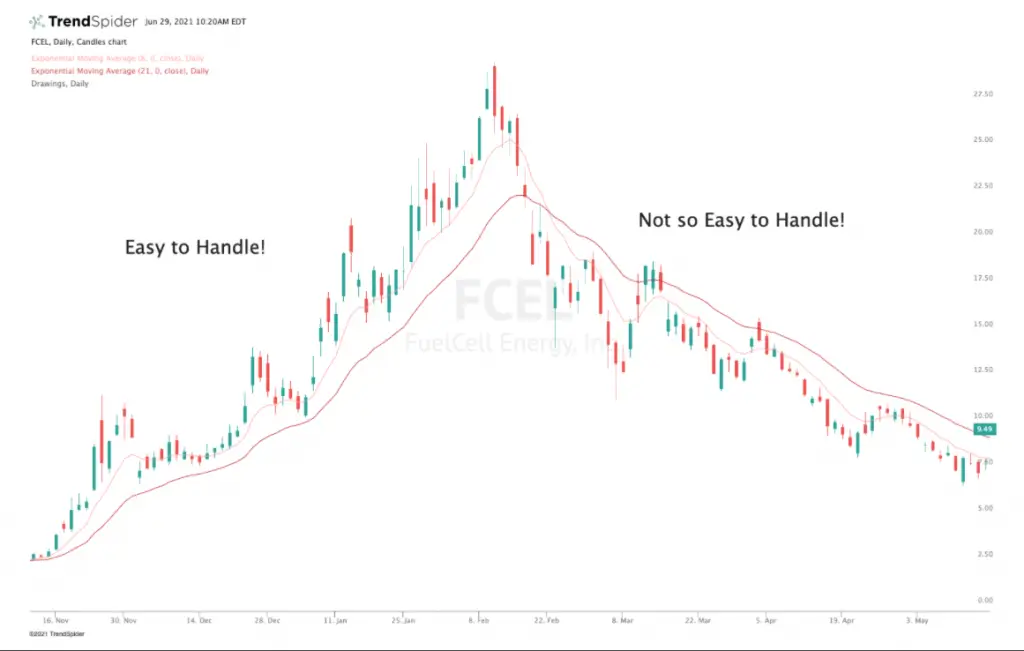
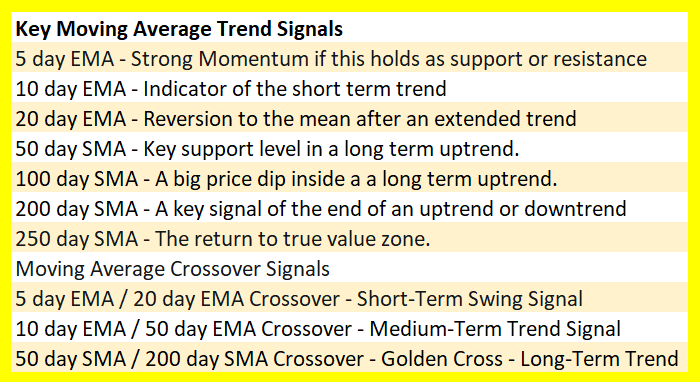
What are the most used moving averages on charts and in technical analysis? The popularity of specific moving averages on different time frames can give them meaning as more people are watch... Read more
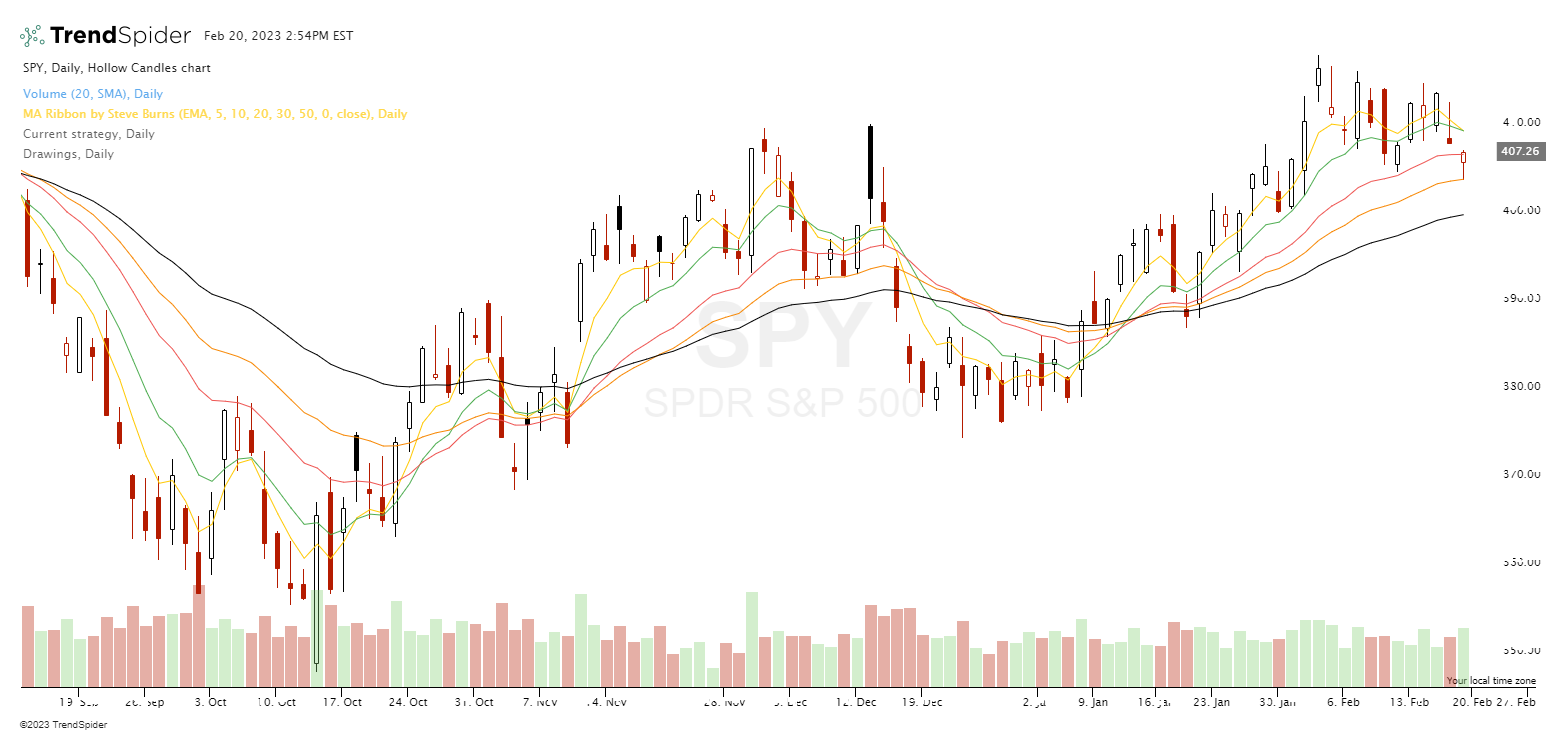
The Steve Burns Ribbon technical indicator is a new tool for the technical analysis of stock trends by combining key moving averages. The MA Ribbon by Steve Burns is currently available on t... Read more
Using the 250-day moving average as a green light to be long when price is above it or a red light to be in cash if price is below it can be used as a long term trend filter for trading the... Read more
A simple moving average is a technical indicator that you can use to quantify price trends and trading signals. Moving averages can be used for the following: Entry signal Exit signal Traili... Read more
Moving averages are technical trading tools for capturing trends in the stock market. Moving averages are price action filters that can identify a trend by which side of a moving average pr... Read more
Moving averages are primarily used as trend indicators and trend filters. They are quantified technical trading indicators that can be used for backtesting and signal creation. Using moving... Read more
Moving averages are technical trading tools that can help identify trends on different time frames. They can replace opinions and predictions for making trading decisions by being used as si... Read more
A moving average crossover signal is when you use both a short term moving average and a long term moving average on the same chart. A crossover signal is generated when the moving averages... Read more