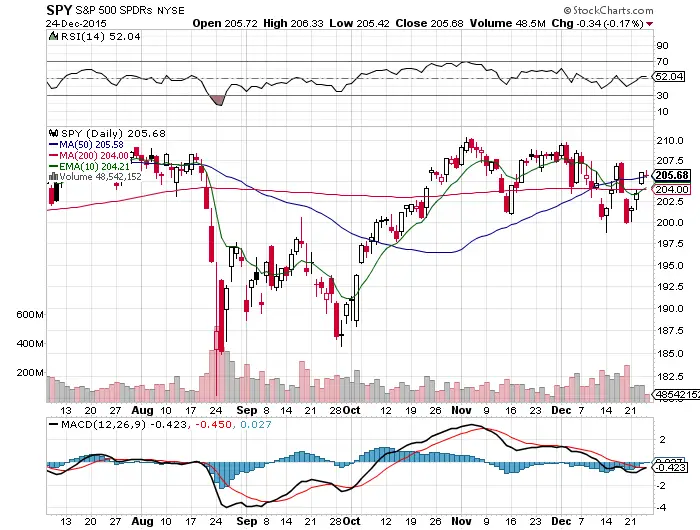
- The $SPY over the 200 day SMA puts us on the bullish side of the chart, but it hasn’t held all year as support.
- Last week’s up days were much lower volume than the previous week’s down days.
- We are entering a seasonally bullish time of year. “Technically, the Santa Claus rally time period starts December 24th and ends Jan 5 , as defined by Yale Hirsch.” via Bob Lang
- The MACD has come close to a bullish crossover. This will be a momentum long signal if it happens next week.
- The RSI is at 52.04, showing the market has momentum.
- Near-term $SPY chart support is at $200.
- Near-term resistance is at all-time highs at an unadjusted price of $213.78.
- Some leading stocks are forming nice price bases and waiting to break out: Alibaba, Facebook, Veeva Among Bullish IBD 50 Setups
In this market, it’s crucial to buy weakness and sell strength. Taking profits off the table while they are there has been the theme of 2015 because no long term trend has emerged.
Full disclosure: I am currently long $UDOW. My stop loss is a close under the 200 day SMA.