Skip to content
 Chart Courtesy of StockCharts.com
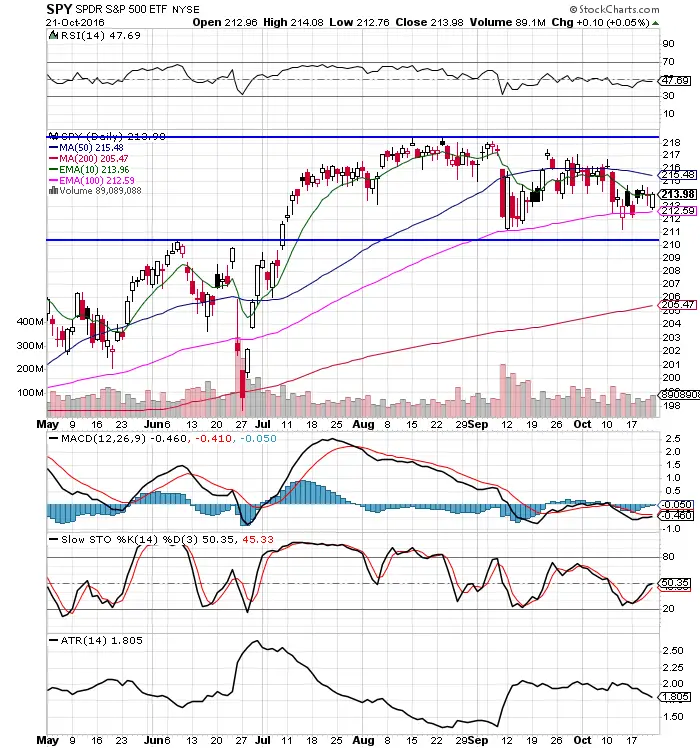
- We are currently in a range bound market.
- Long term resistance remains at all time highs.
- $210 is a key price support level as it was resistance at the beginning of the year.
- The 100 day EMA has provided a key support level since September.
- $SPY has closed under the 10 day EMA 8 of the last 9 days which is bearish.
- $QQQ is showing relative strength over $SPY.
- MACD is still under a bearish cross.
- Slow Stochastics has a bullish cross.
- The ATR declined last week, the trading range continues to narrow.
- This remains a buy the dip market. I will continue to look to buy deep dips and sell into rips higher in price.
